ScaleWatcher Cloud is an enterprise platform for real-time transaction monitoring and analytics in logistics and material handling facilities. It extends the capabilities of the on-premise ScaleWatcher system by providing secure, web-based access to your facility data from anywhere with an internet connection.
The platform tracks vehicle events as they move through your facility, capturing images, weight data, and timing information at each step. This data is compiled into a complete record (transaction), giving you visibility into your operations and the documentation needed for accountability.
1.2 Who Is This Guide For?
This guide is intended for:
Facility Managers monitoring daily operations and responding to alerts
Operations Administrators overseeing multiple sites and managing users
Logistics Personnel tracking vehicle movements and transaction history
Compliance Specialists investigating anomalies and generating audit documentation
Site Administrators managing user access and system configuration
1.3 Key Benefits
Visual Documentation
Capture images of every vehicle transaction with ticket data overlaid. Provides clear proof of the weighing and ticketing process.
Operational Efficiency
Track facility times, load times, and wait times. Identify bottlenecks and opportunities to improve throughput.
Anomaly Detection
Automated alerts notify you when transactions fall outside normal parameters — missing tickets, weight mismatches, or potential compliance issues.
Accountability
Complete transaction records with timestamps and images support dispute resolution and audit requirements.
Remote Access
Monitor your facilities from anywhere. View real-time data and historical records through any modern web browser.
Business Intelligence
Built-in reports provide insights into facility performance, carrier efficiency, product volumes, and operational trends.
2. System Architecture
2.1 How ScaleWatcher Cloud Works
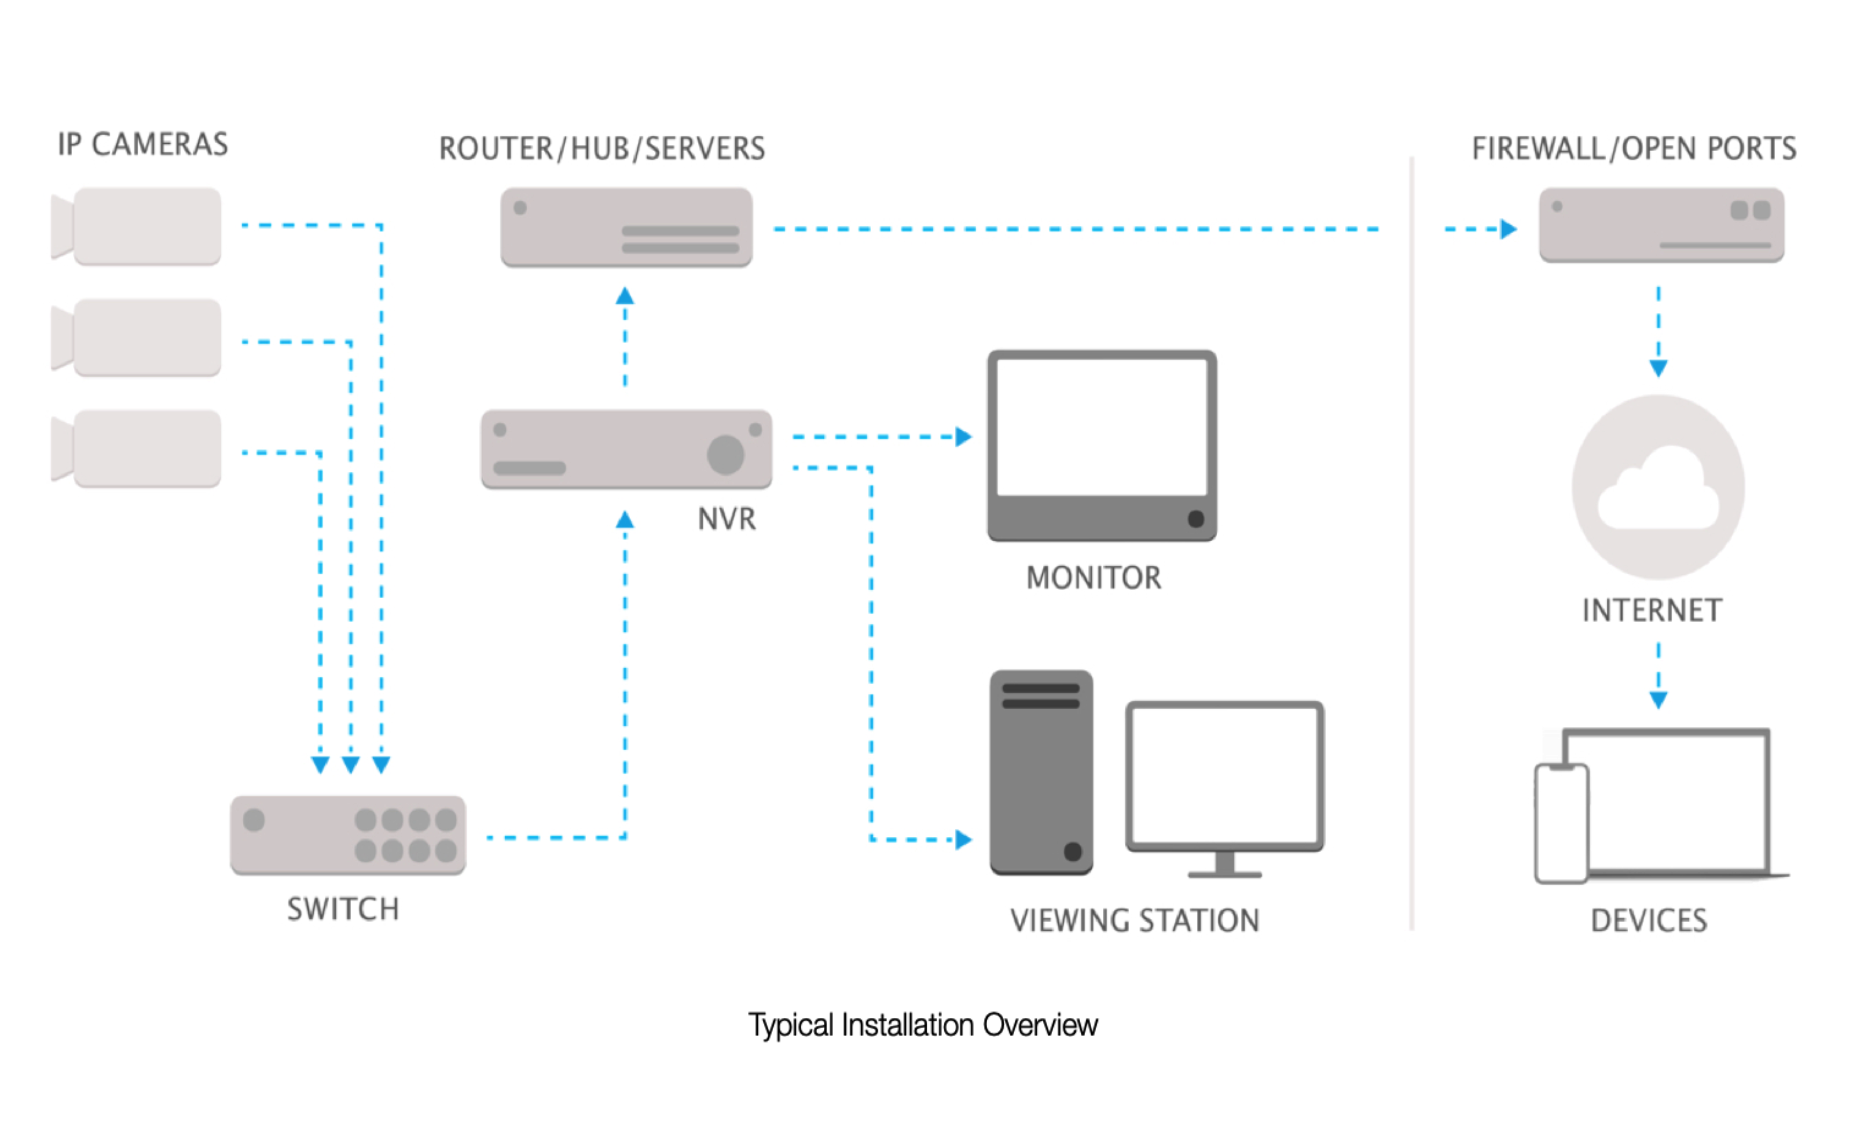
ScaleWatcher Cloud operates as part of a connected system that includes on-premise hardware and cloud-based services.
On-Premise NVR (Network Video Recorder)
The Dividia NVR at your facility captures video from cameras positioned at key points — facility entrance, exit, and scale etc. It processes license plate recognition (LPR), receives scale weight data, and compiles individual events into complete transactions. Once a transaction is complete, the NVR securely uploads the data to the cloud.
Cloud Backend
The Dividia cloud server receives transaction data from your NVR, stores it securely, and makes it available through the web application. This includes all event data, images, and computed metrics.
Web Application
ScaleWatcher Cloud is accessed through your web browser. No software installation is required. Simply navigate to the application URL and log in with your credentials.
Note: The on-premise NVR remains a required component. It handles all video recording, license plate recognition, and event processing before uploading to the cloud.
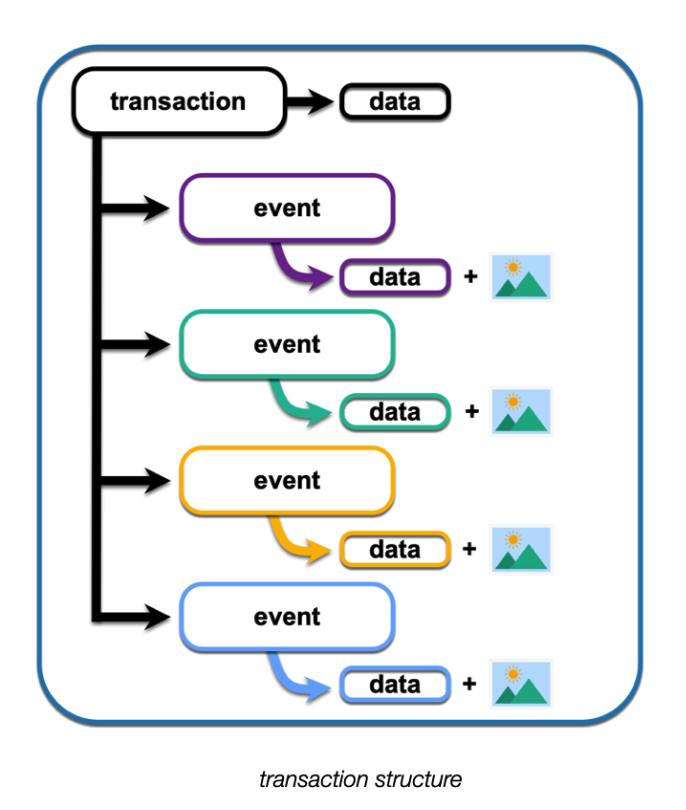
2.2 Transactions and Events
Understanding the relationship between transactions and events is key to using ScaleWatcher Cloud effectively.
Transaction
A transaction represents a single vehicle's complete journey through your facility—from entering to exiting. Each transaction contains multiple events and is identified by the vehicle's license plate number (LPN) or Truck ID (based upon ticket information received).
Event
An event is a single action captured during a transaction. Common events include:
Event
Description
Facility In
Vehicle enters the facility (captured by entrance camera)
Scale Truck Entering
Vehicle begins pulling onto the scale
LPR Read
License plate recognized by camera
Scale Truck On
Vehicle fully on scale, weight captured
Ticket Received
Ticket data received from ticketing system
Scale Truck Leaving
Vehicle begins leaving the scale
Facility Out
Vehicle exits the facility (captured by exit camera)
Each event includes a timestamp and may include images and additional data. Together, the events form a complete picture of the transaction.
3. Getting Started
3.1 System Requirements
ScaleWatcher Cloud runs in your web browser. The following are required:
Web Browser: Chrome, Firefox, Safari, or Edge (current version recommended)
JavaScript: Must be enabled in your browser
Internet Connection: Stable connection to access the application
Screen Resolution: 1280x720 or higher recommended
3.2 Network Requirements
For End Users (Web Access)
Your device must be able to reach: https://scalewatcher.cloud.dividia.net
For On-Premise NVR
The NVR at your facility requires outbound HTTPS access to: https://api.cloud.dividia.net
Your network firewall must allow outbound connections on port 443 (HTTPS) from the NVR to the Dividia cloud server.
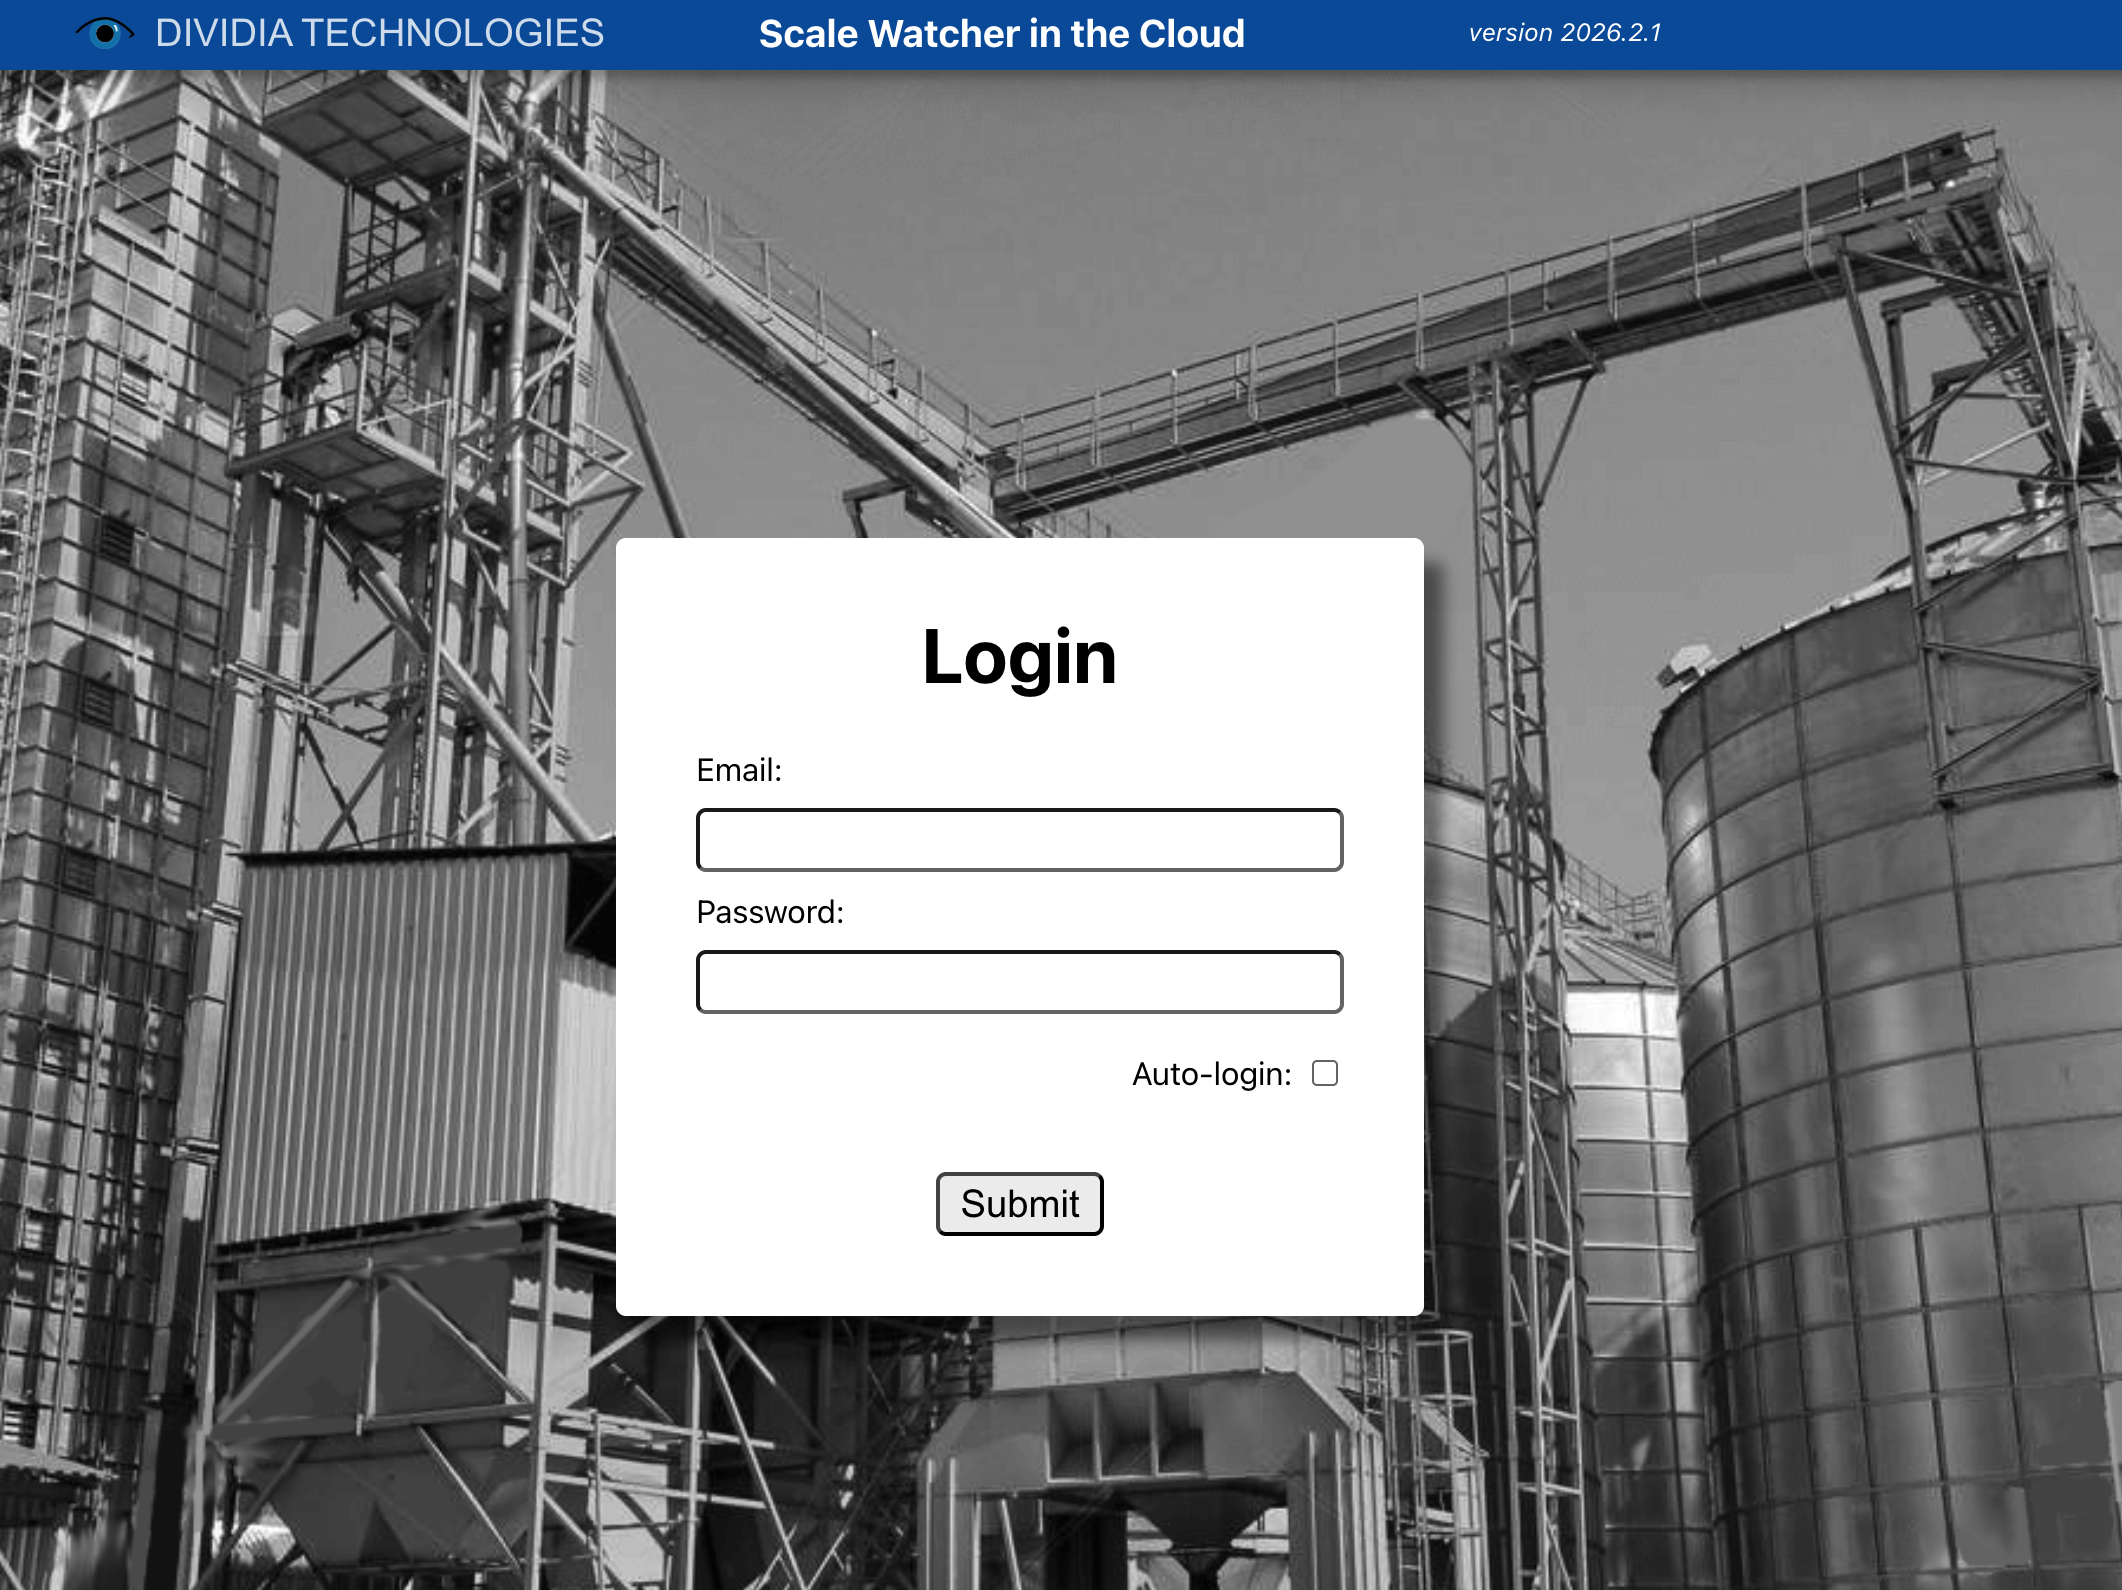
3.3 Logging In
Open your web browser
Navigate to: https://scalewatcher.cloud.dividia.net
Enter your Email and Password
Click Submit
Auto-Login Option
Check the "Auto-login" box to remain logged in on this device. Your session will persist until you explicitly log out.
Demo Access
To explore ScaleWatcher Cloud with sample data, use the demo credentials:
Email: demo@dividia.net
Password: demo
Need Credentials?
Contact your Dividia Technologies representative to obtain login credentials for your organization.
4. User Interface Overview
After logging in, you'll see the main ScaleWatcher Cloud interface. The application is organized into several key areas.
4.1 Application Header
The header bar appears at the top of every screen and provides access to key functions:
Left Section - Search & Reporting
Ticket Search: Find a transaction by ticket number
Transaction Search: Find a transaction by transaction ID
Advanced Search: Build custom search queries
Reporting: Access charts and reports
Center Section - View Navigation
transactions: View the transaction board (default view)
alerts: View and manage operational alerts
Right Section - User & System Info
User Email: Your logged-in account
Logout Button: End your session
Version Info: Current application and API versions
4.2 User Menu
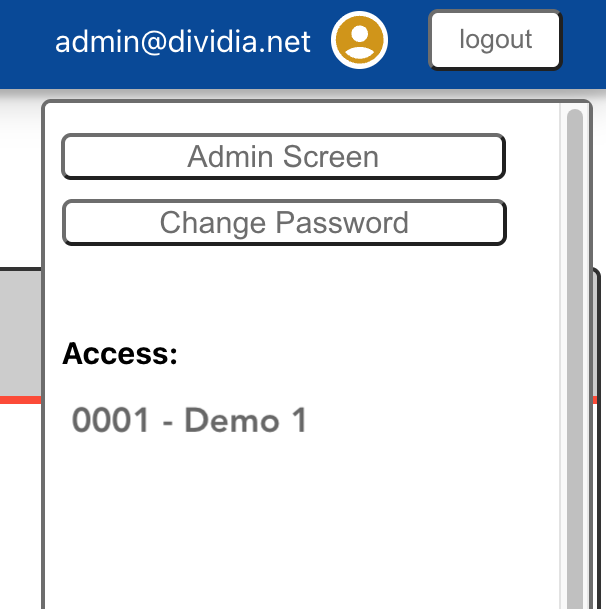
Click your user email or the user icon to open the user menu.
Admin Screen (if you have admin permissions)
Access user management, company settings, and site configuration.
Change Password
Update your account password.
Access
Shows which sites you have permission to view.
User menu
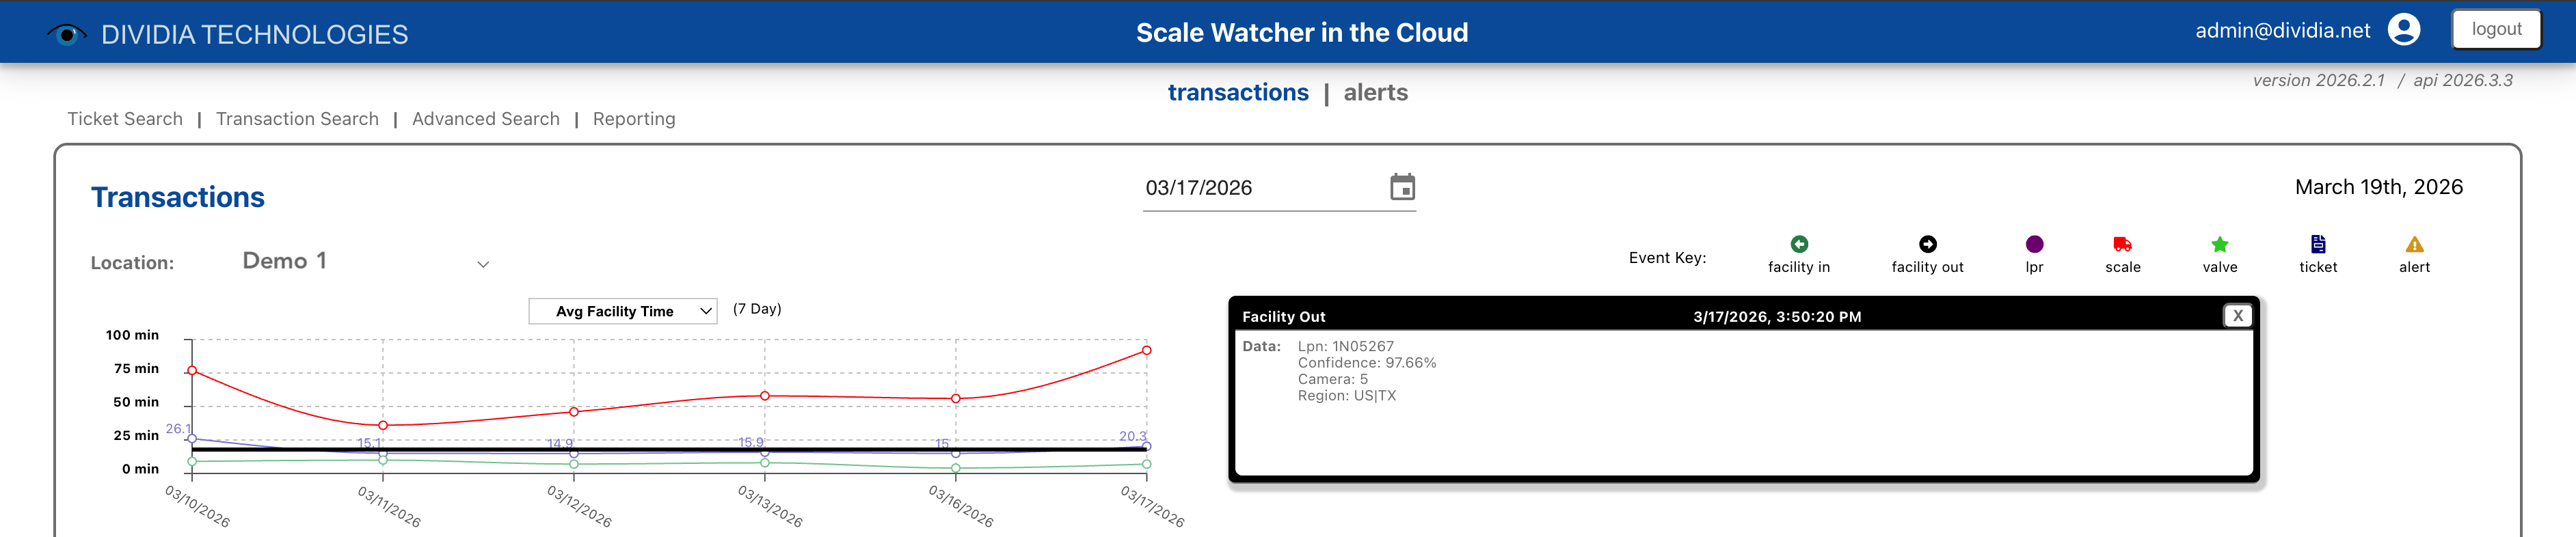
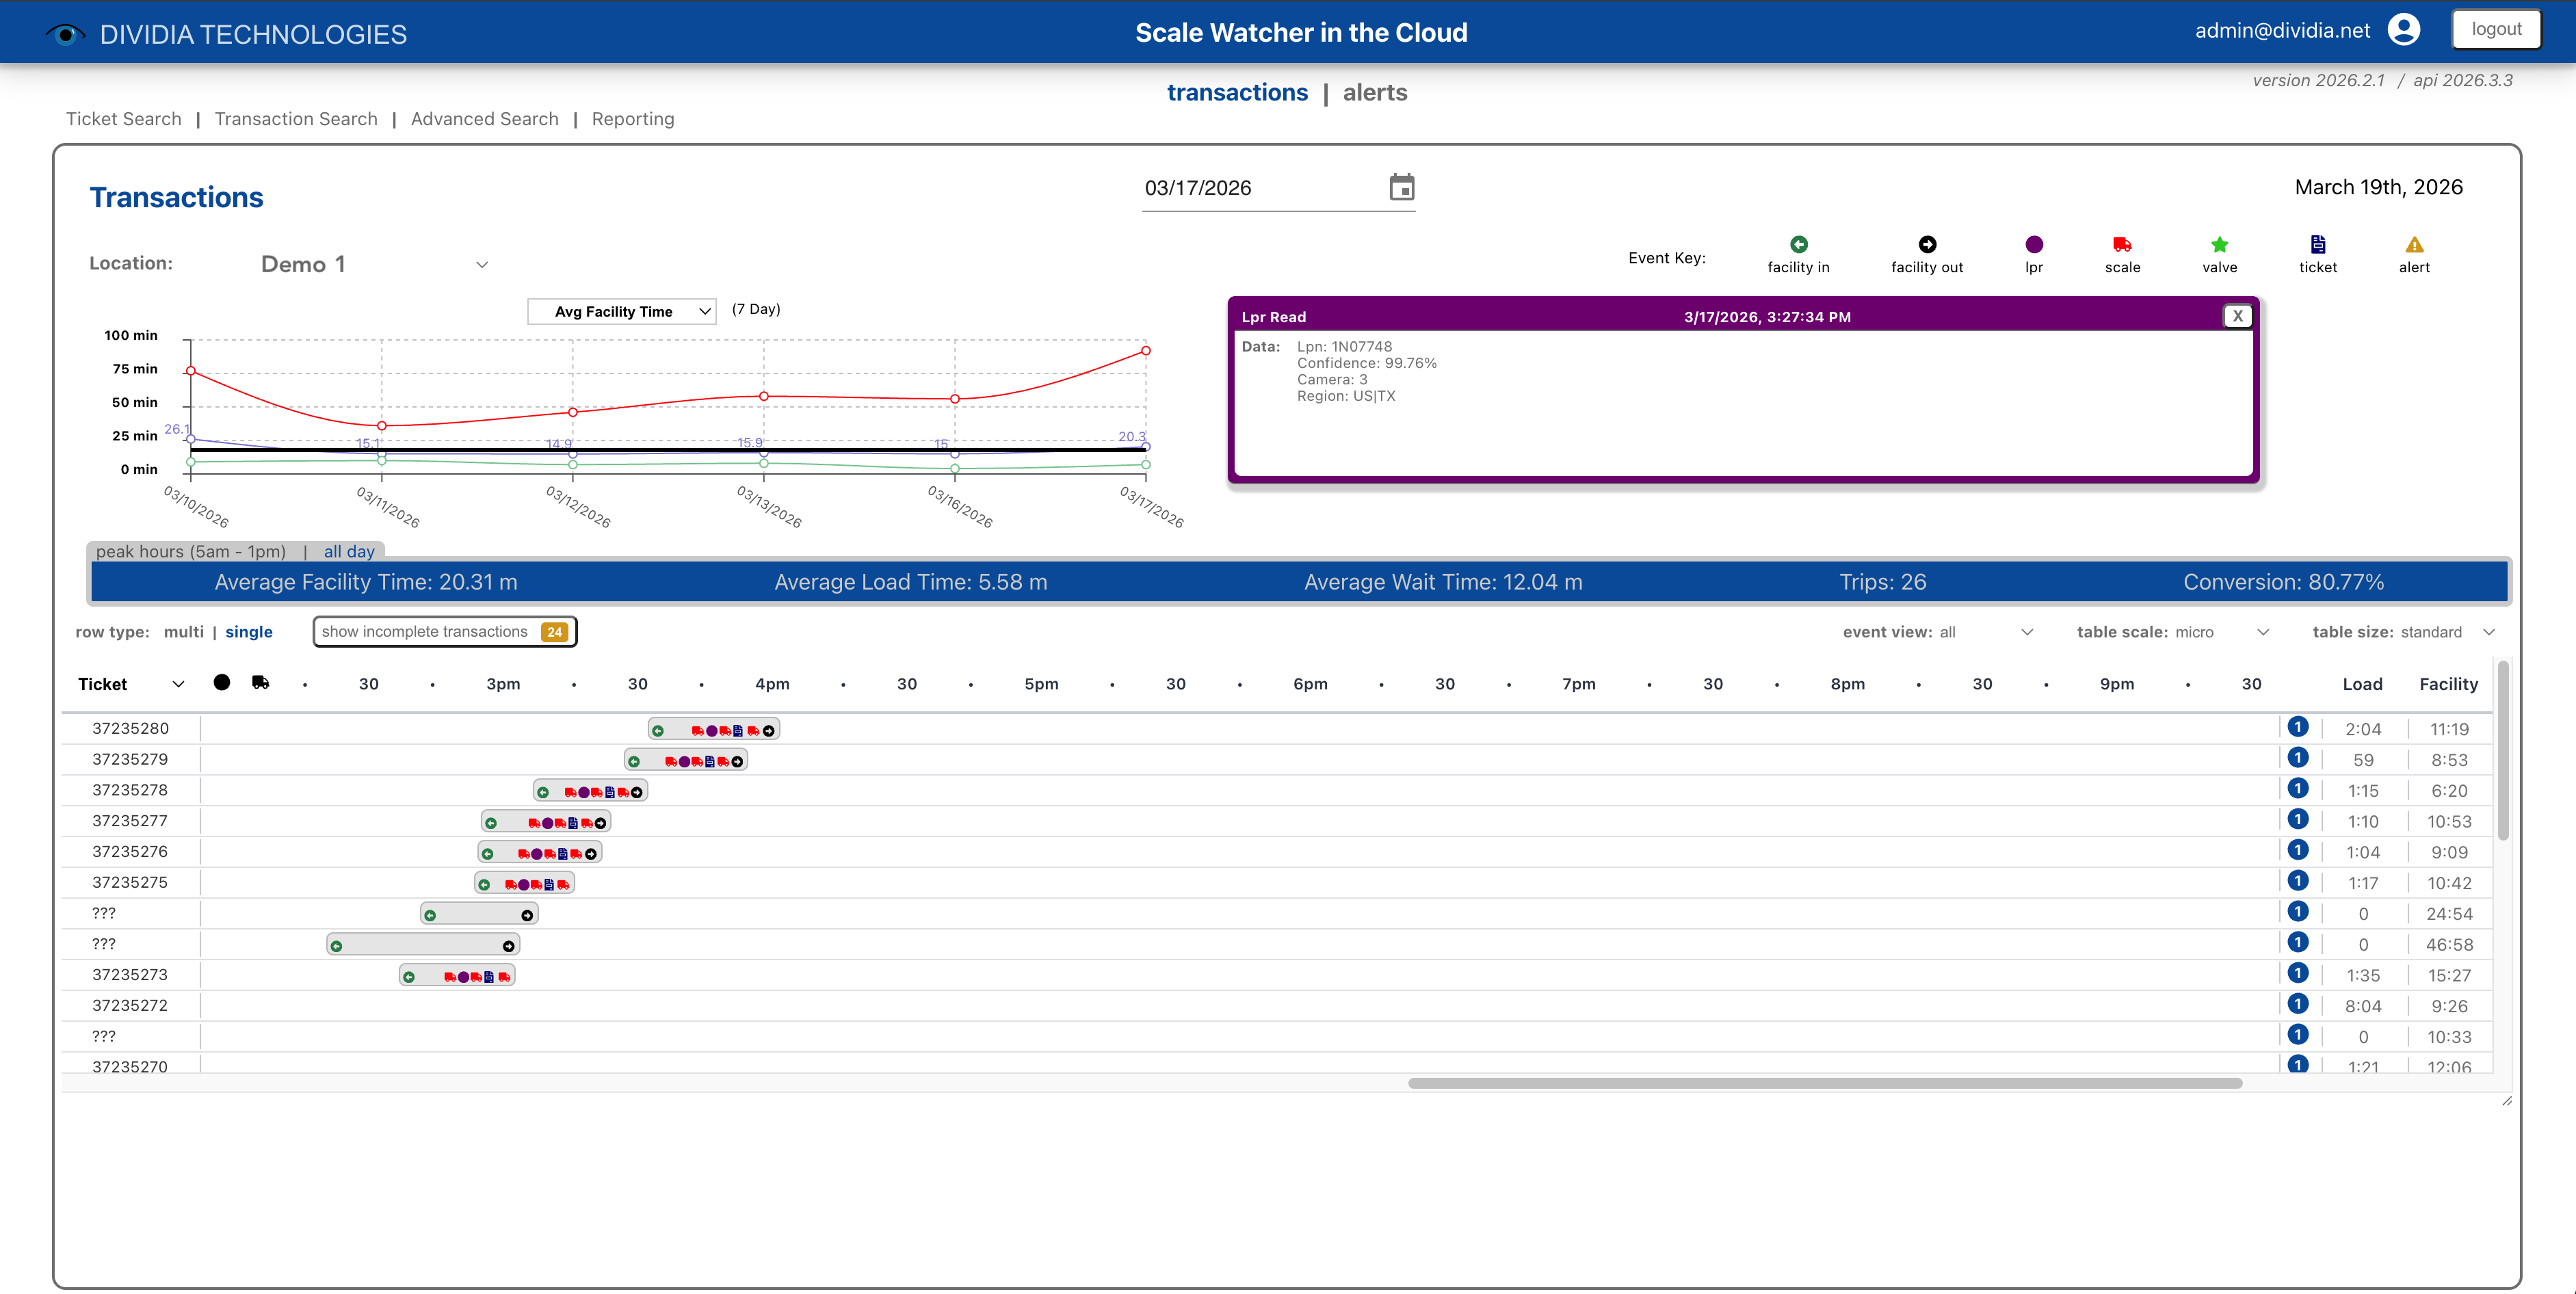
5. Transaction View
The Transaction View is the primary screen for monitoring vehicle activity at your facility. It displays transactions on a visual timeline, allowing you to see the flow of vehicles throughout the day.
Transaction View showing daily activity
5.1 Header Controls
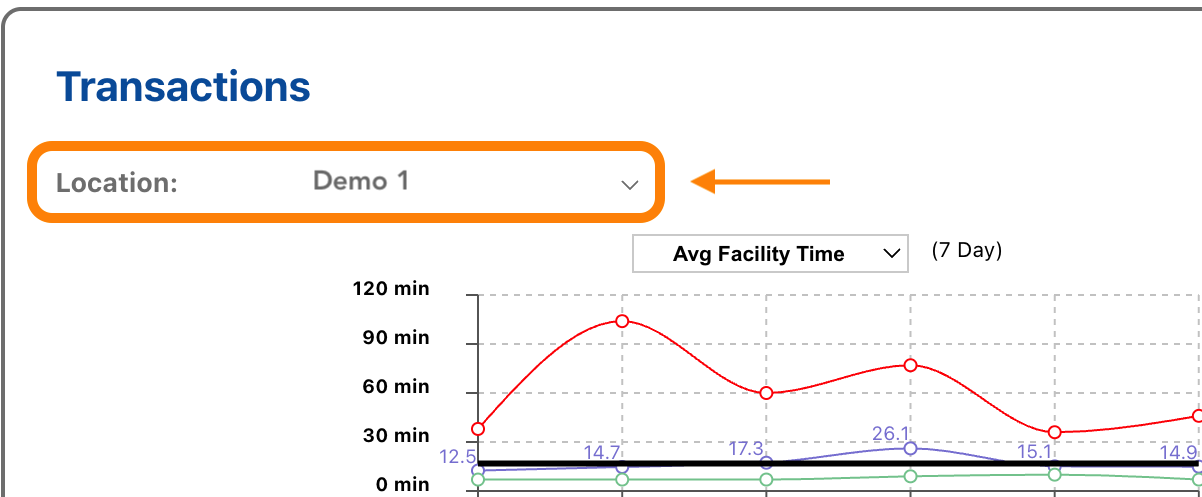
Location Selector
Choose which site to view (if you have multi-site access).
Date Picker
Select the date to view. Click the calendar icon to choose a date, or use the arrow buttons to move forward or backward one day.
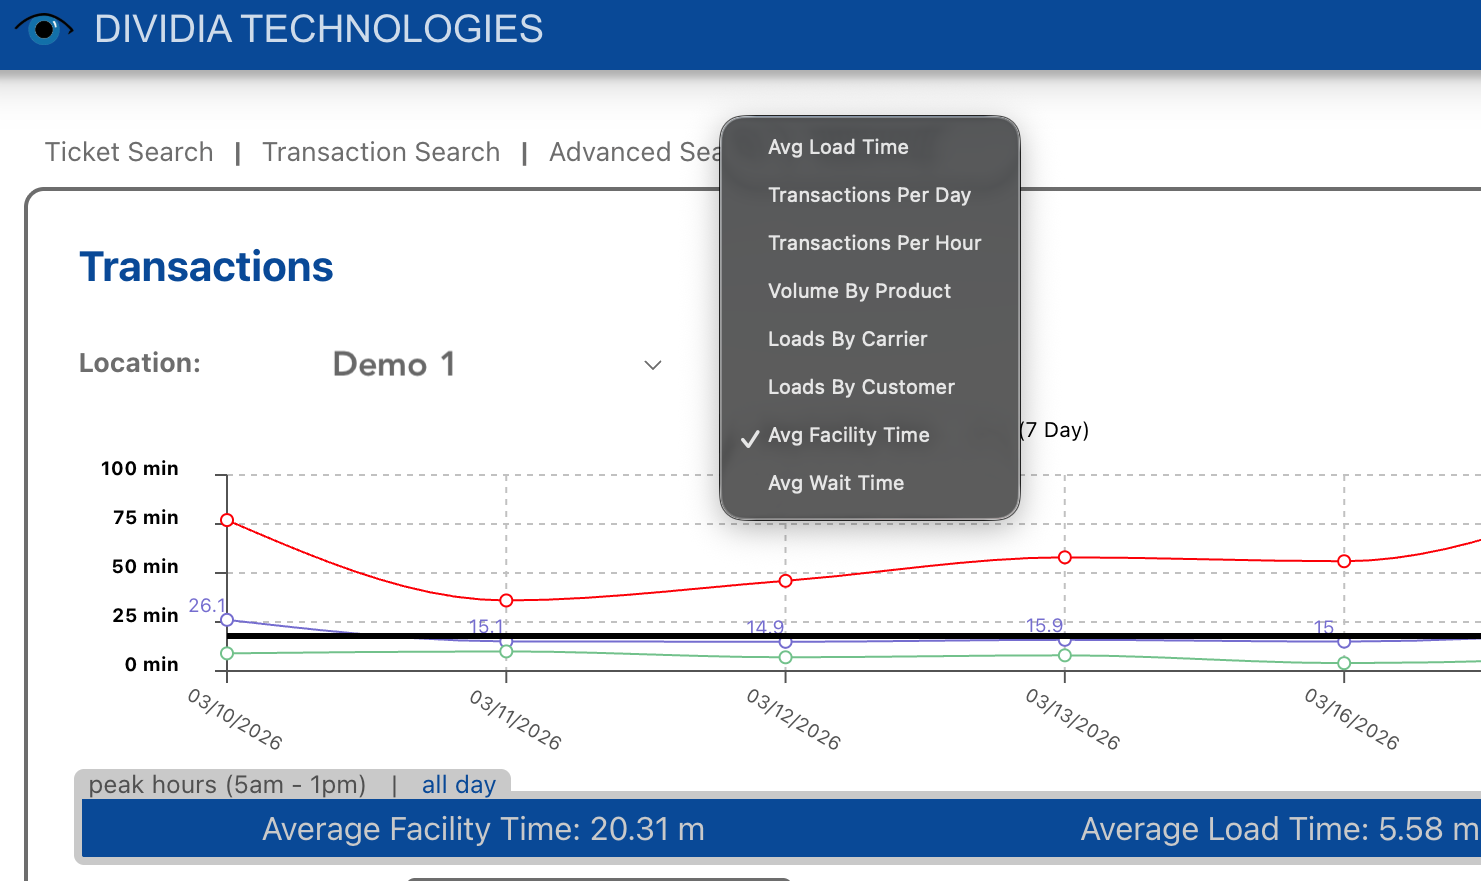
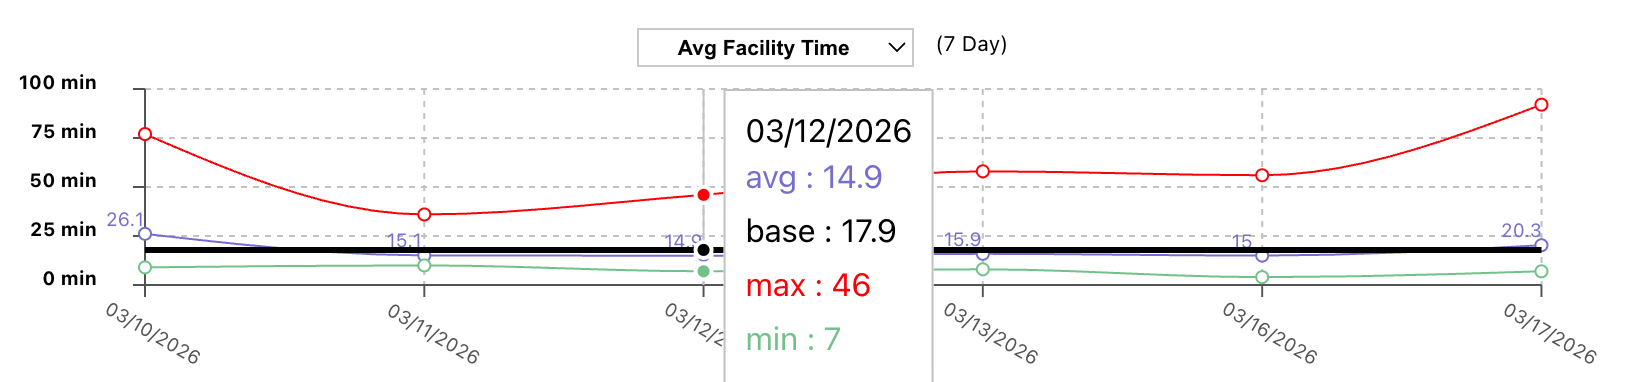
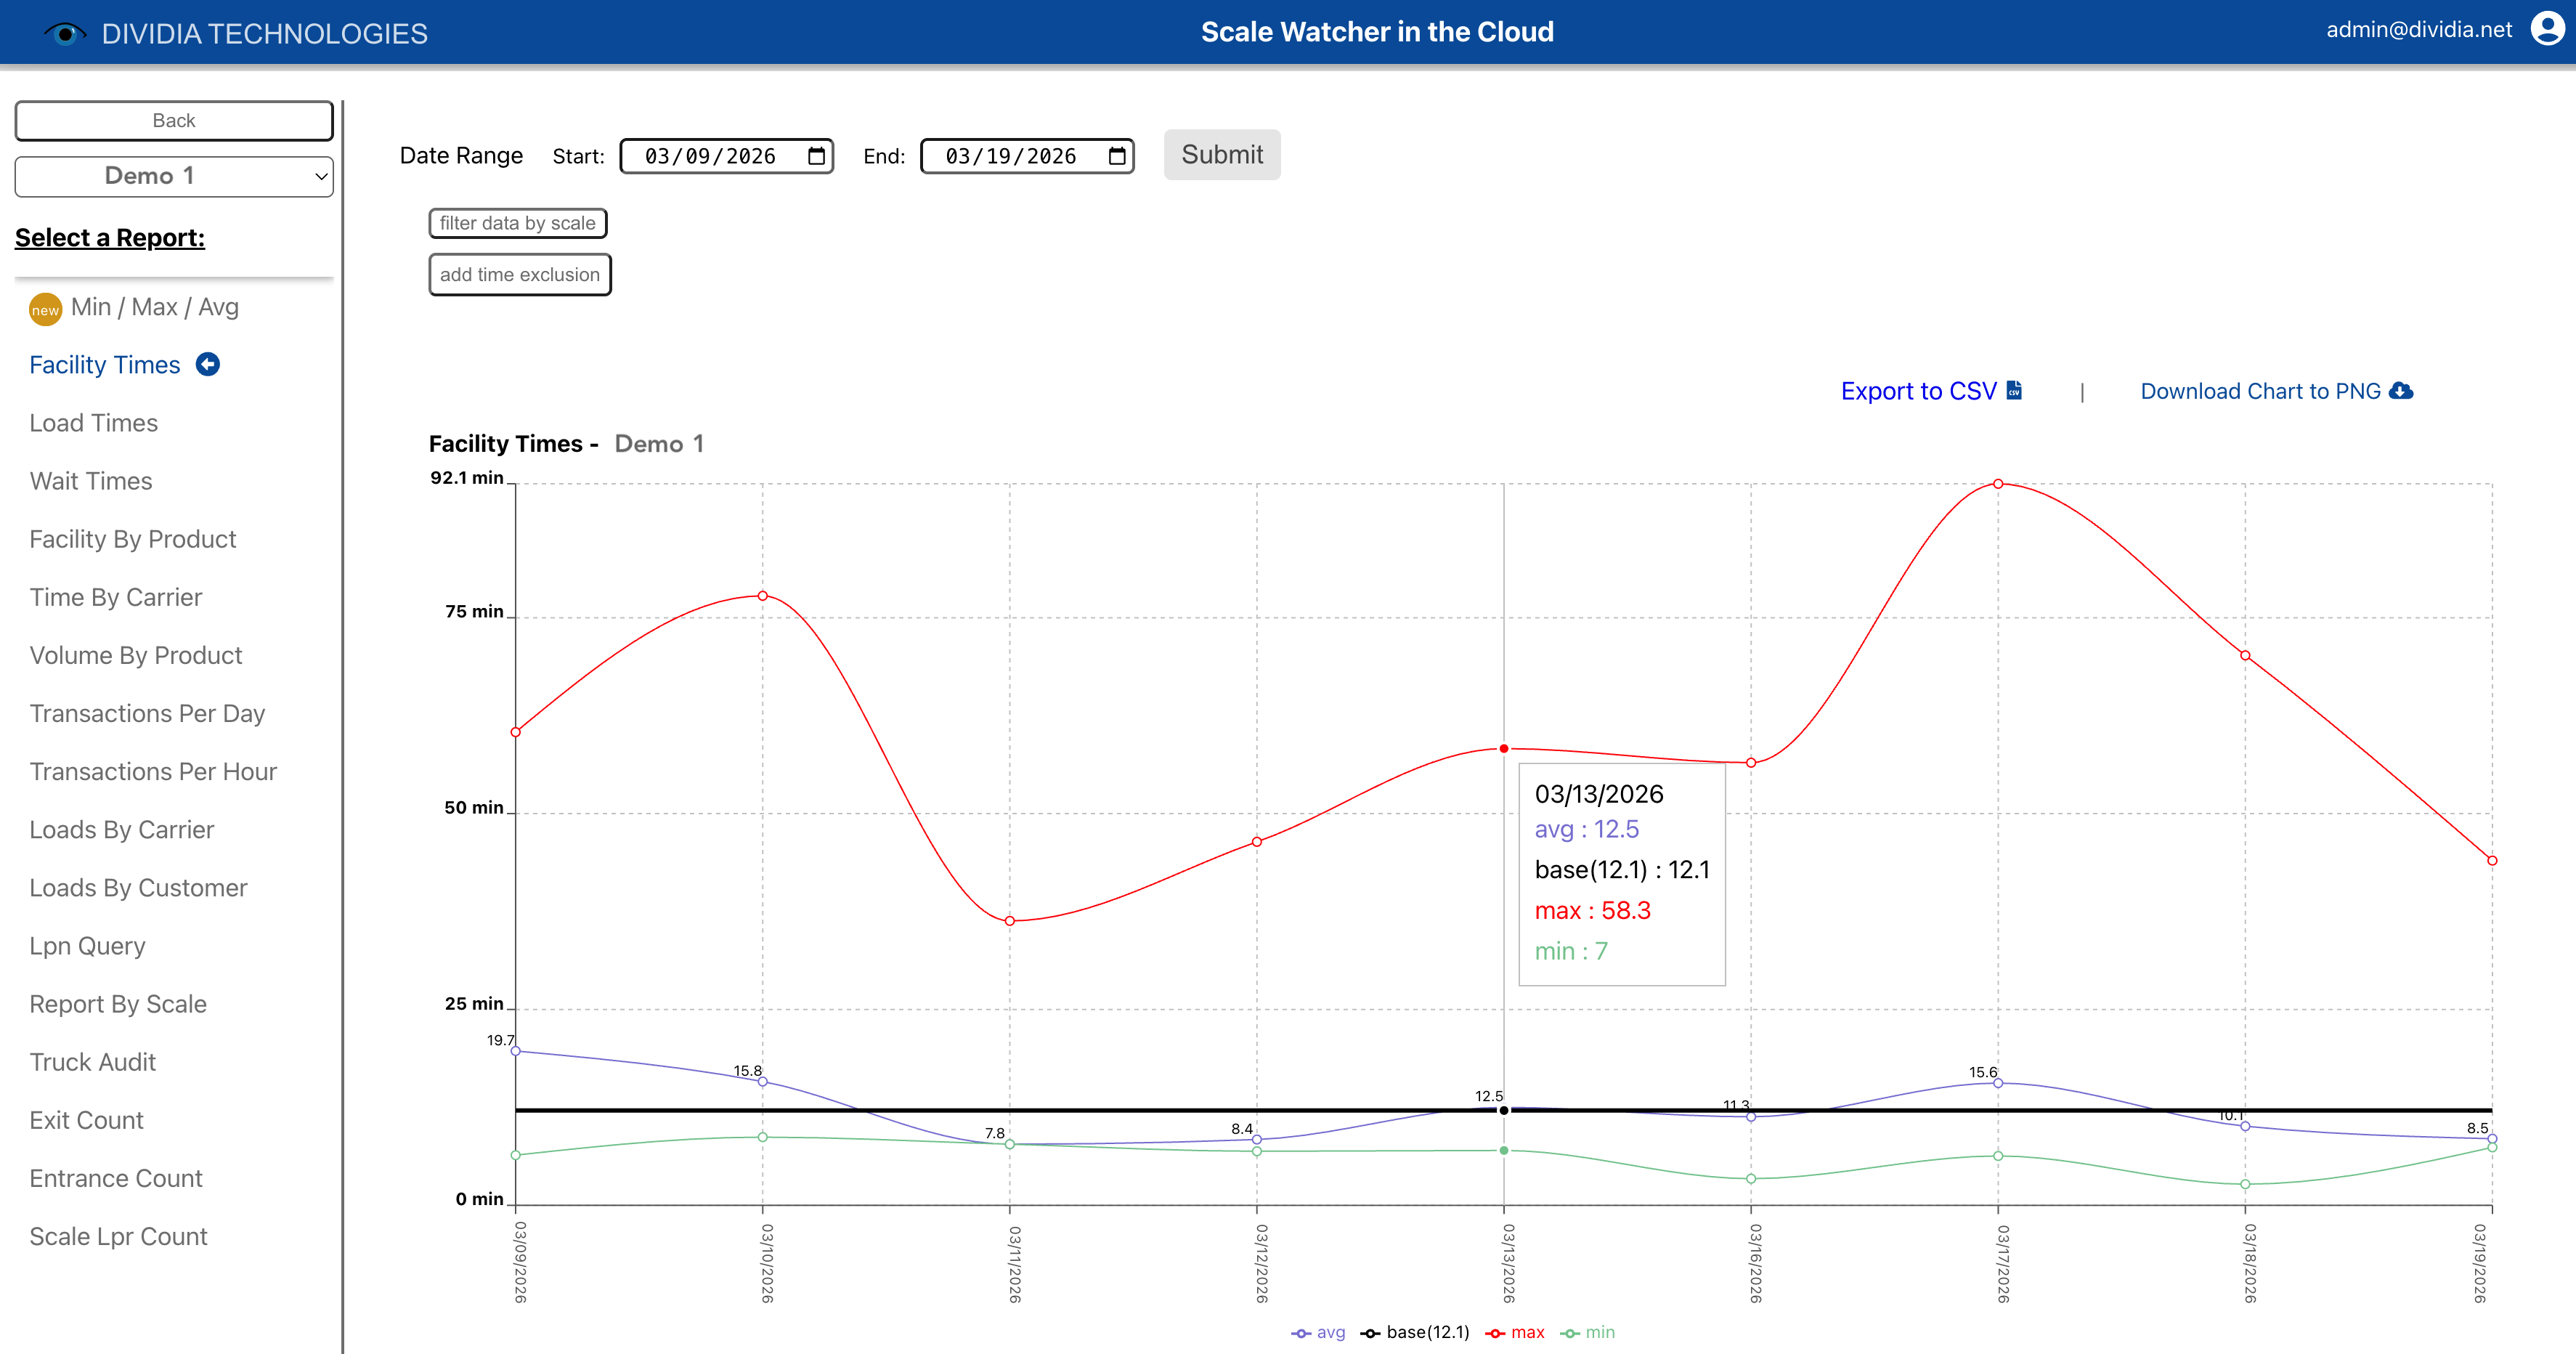
Mini Chart
The small chart in the header shows a 7-day trend. By default, it displays Average Facility Time. Click the dropdown to select other metrics:
Avg Facility Time
Avg Load Time
Avg Wait Time
Transactions Per Day
Transactions Per Hour
Volume By Product
Loads By Carrier
Loads By Customer
Available reports may vary by customer type.
Mini chart options
Hover over a data point to see detailed values for that day.
Mini chart showing detailed hover information
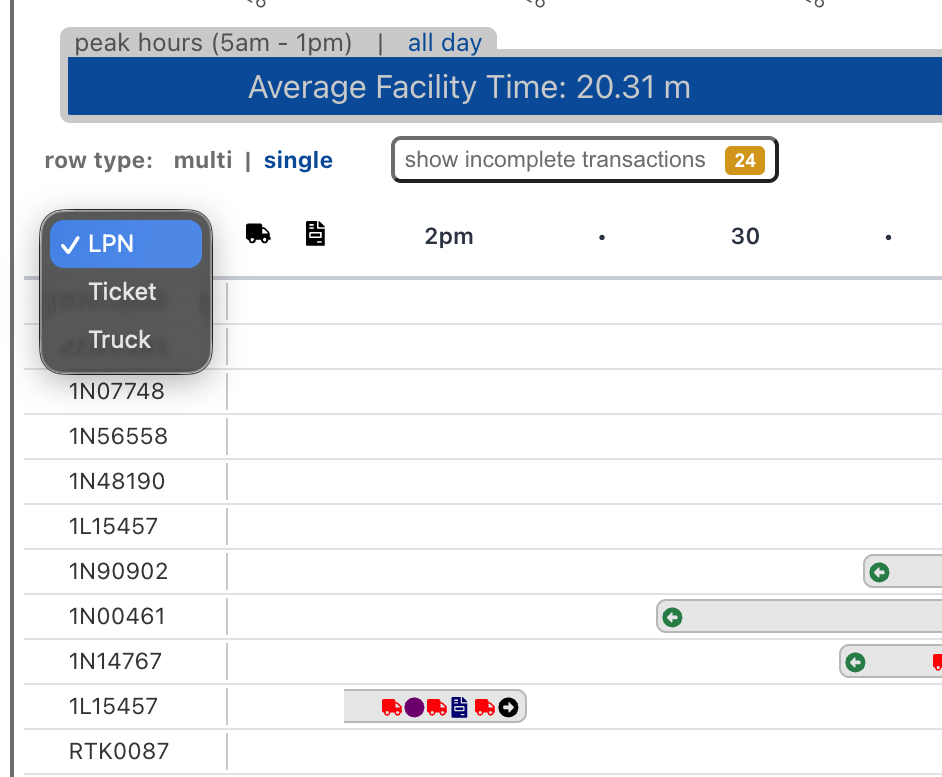
5.2 Information Banner
Below the mini chart, the information banner displays key metrics for the selected date:
Average Facility Time: Average time vehicles spend in the facility
Average Load Time: Average time spent at the scale during loading
Average Wait Time: Average idle time after entering the facility and before 'Load Time' starts
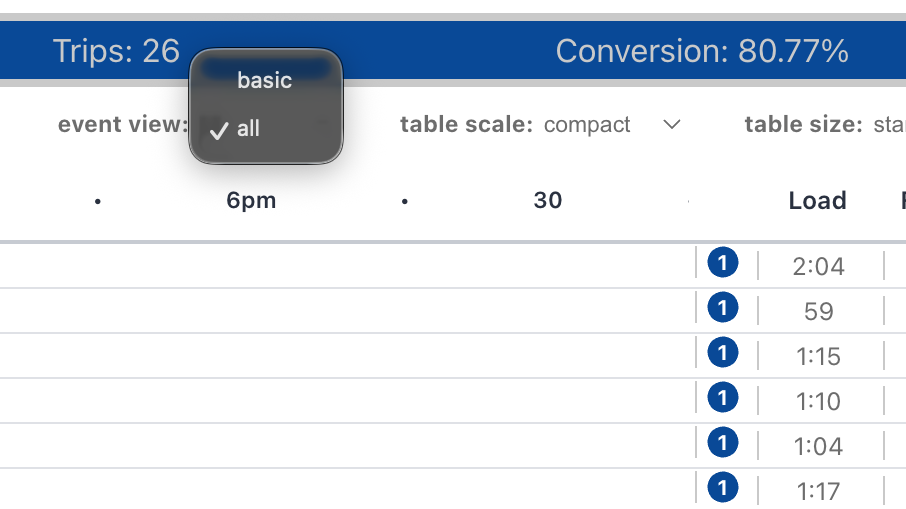
Trips: Total number of completed transactions
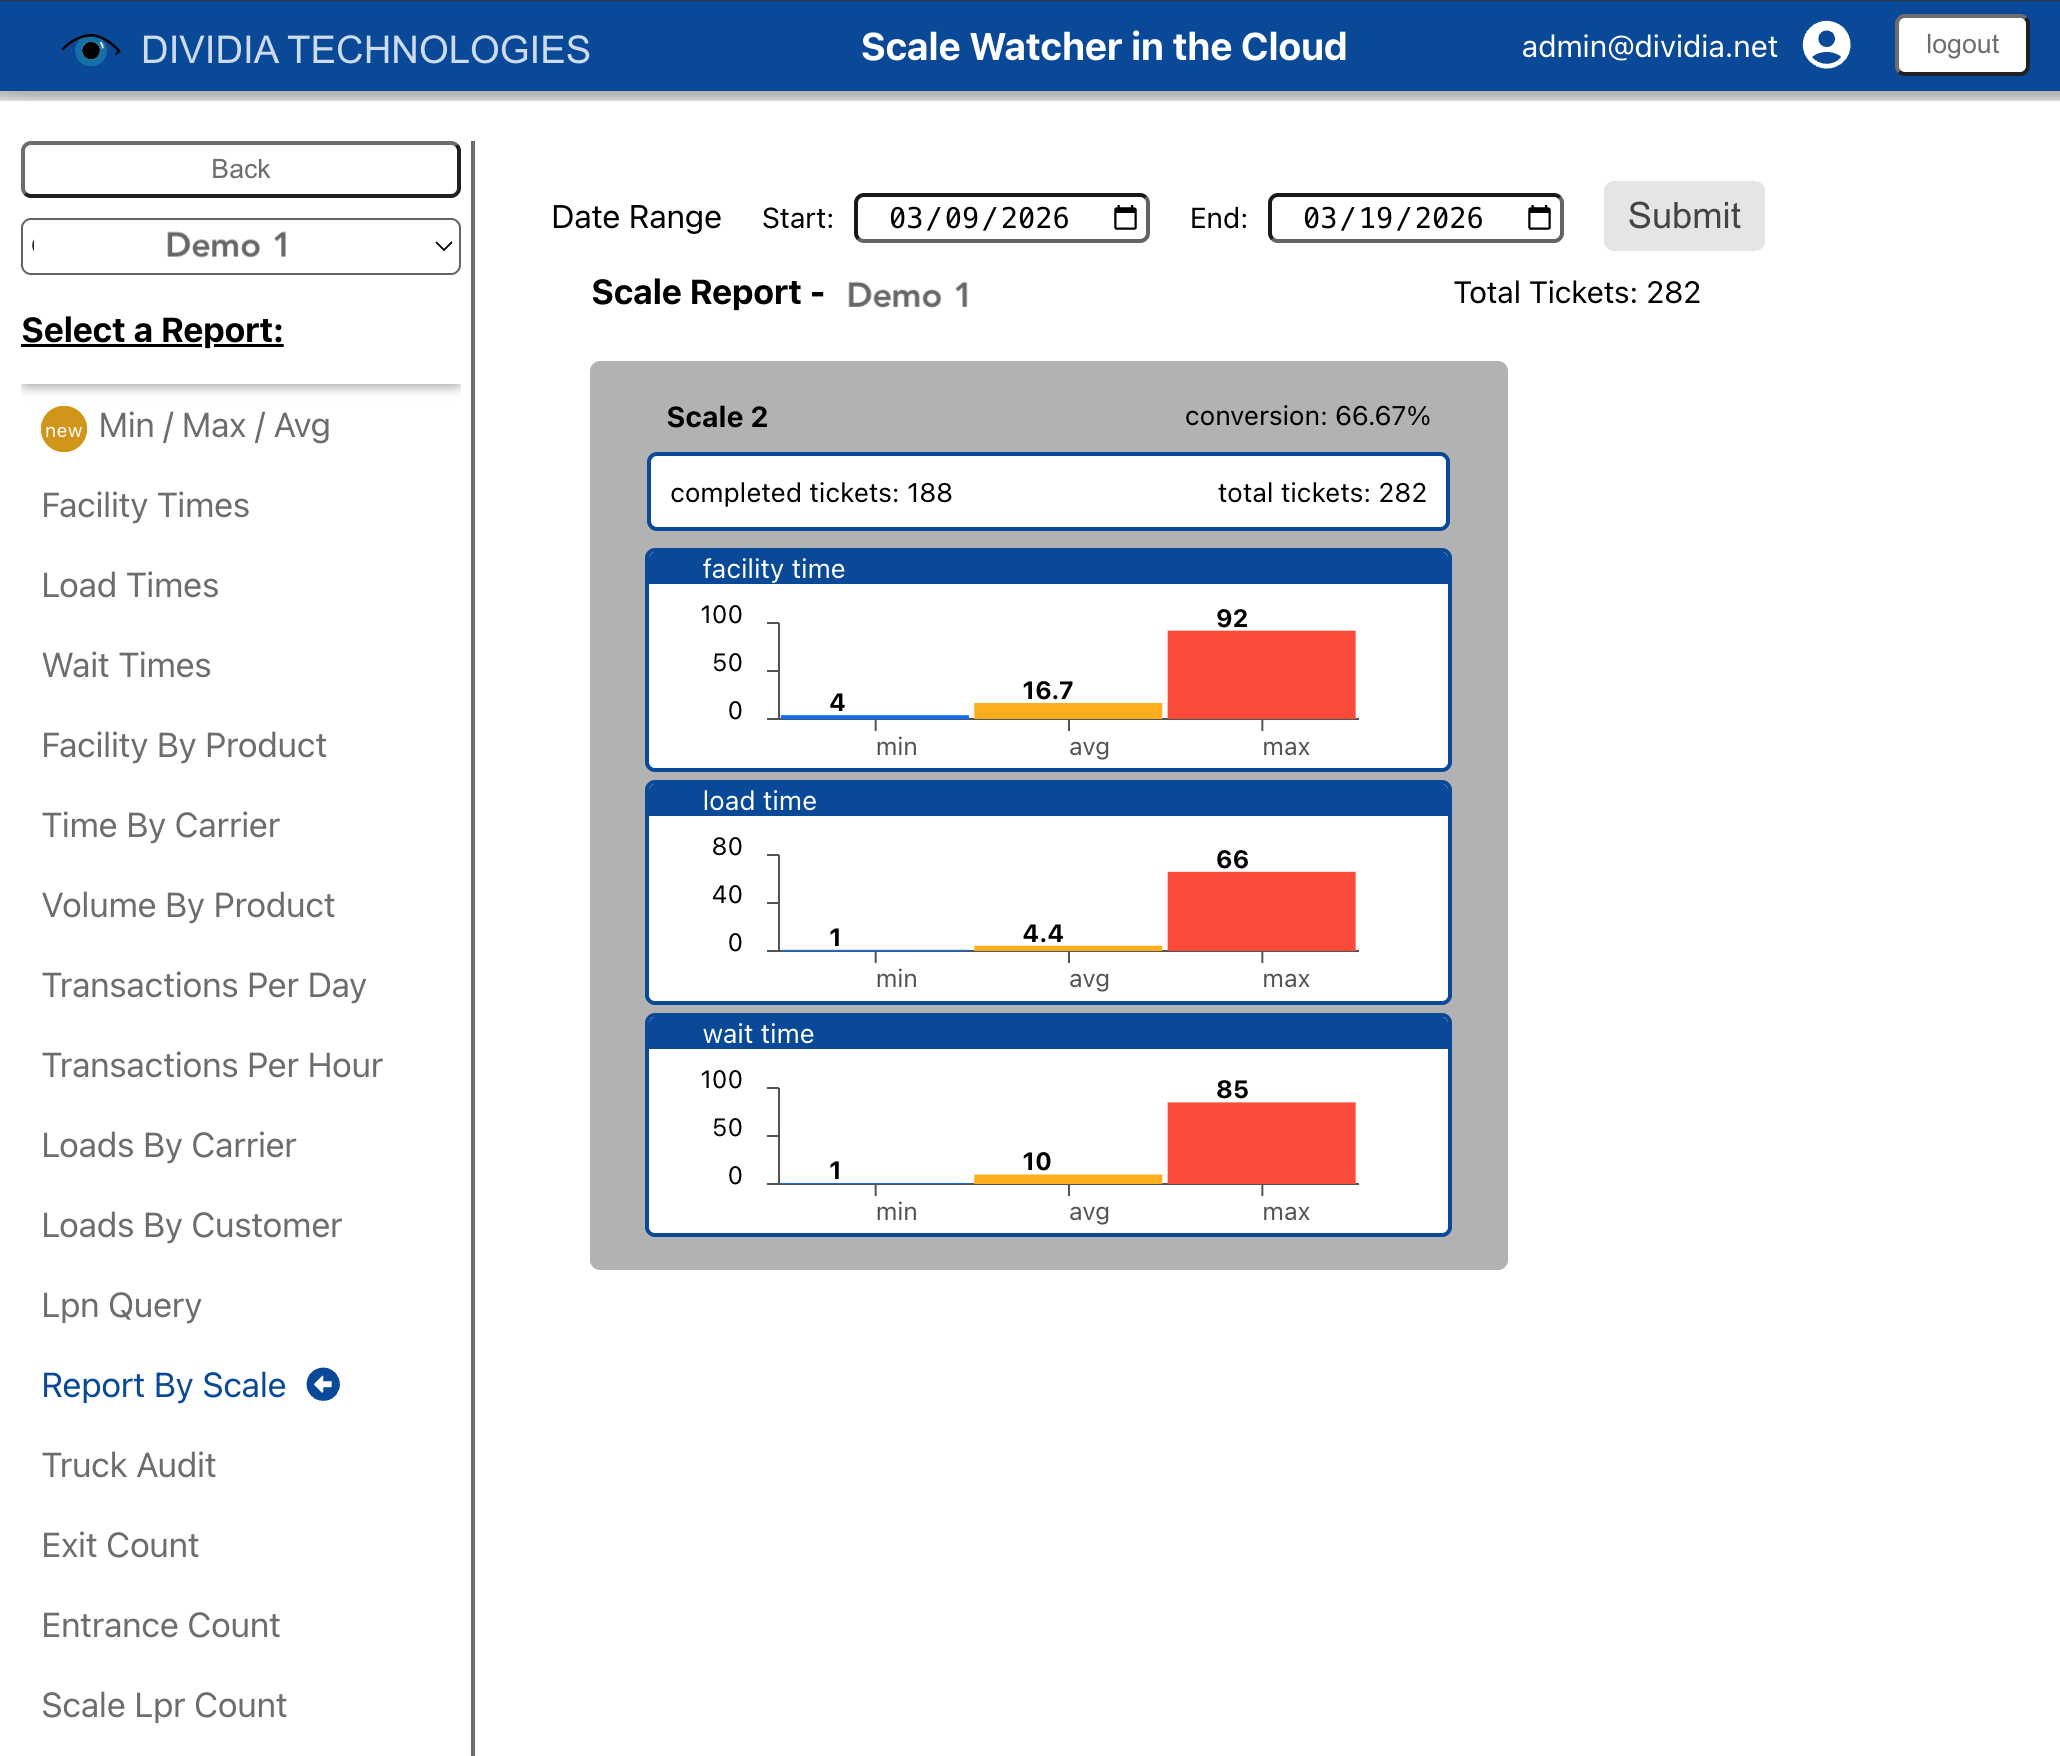
Conversion: Percentage of LPR reads that resulted in completed transactions (Facility / LPR customer types only)
You can filter the data by clicking:
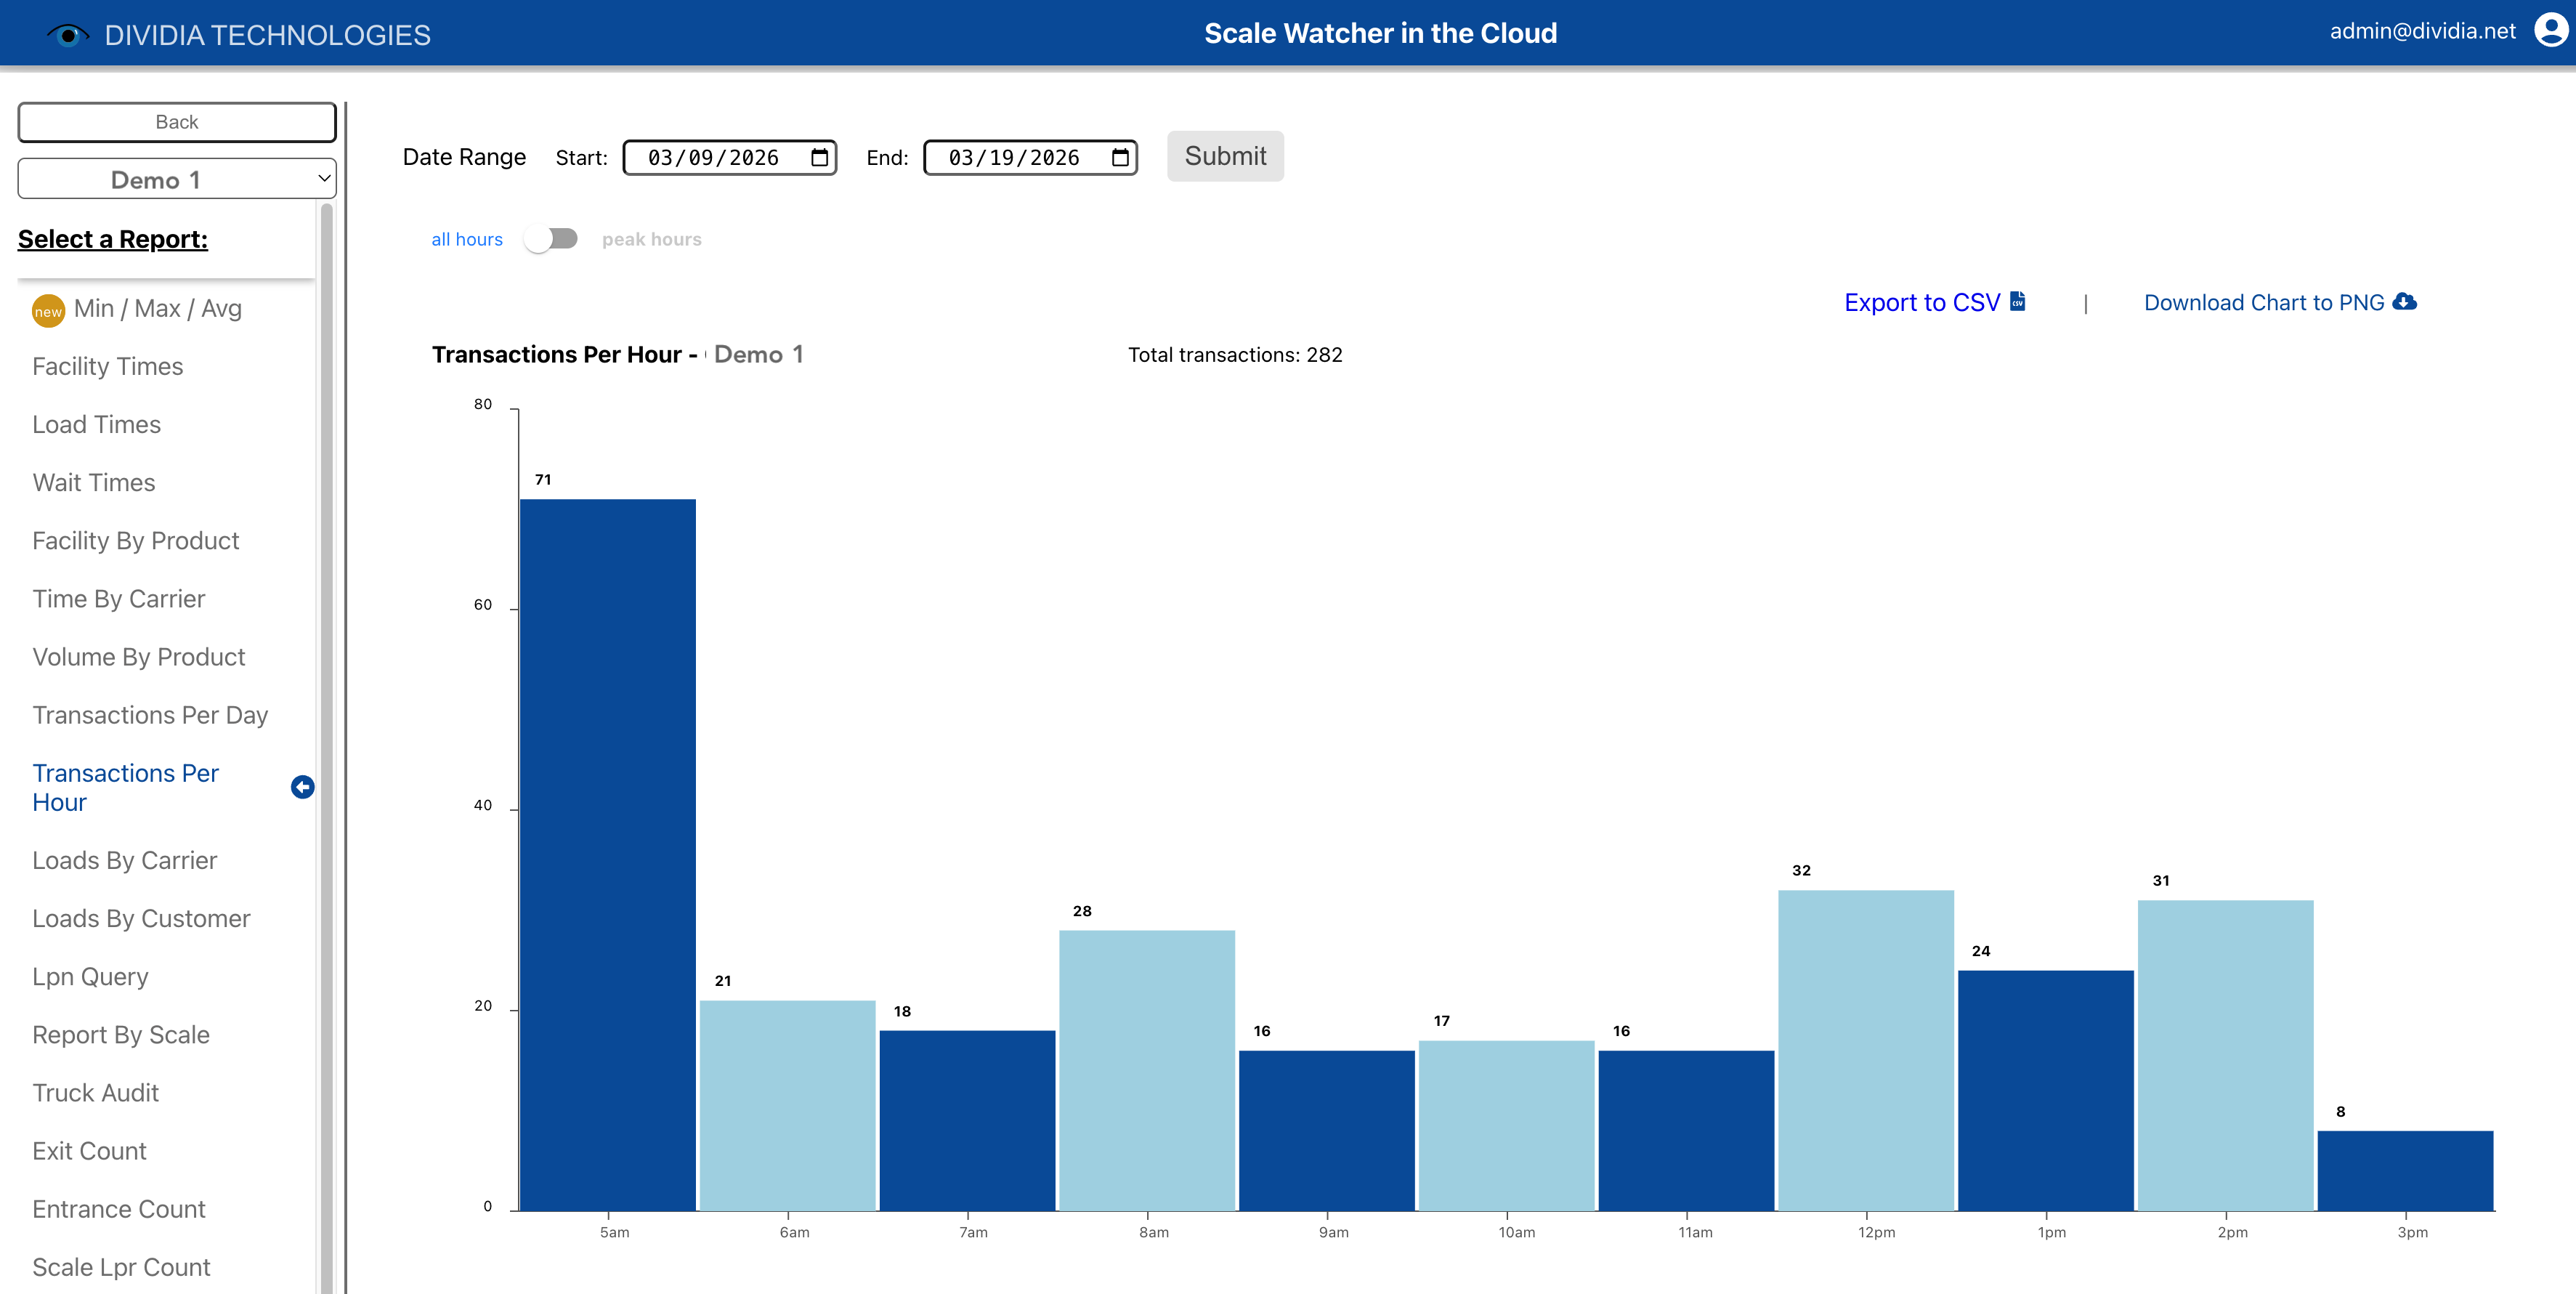
peak hours (5am - 1pm): Show only transactions during peak operating hours
all day: Show all transactions for the full 24-hour period
5.3 Event Key
The Event Key shows the icons used to represent different event types in the transaction table:
Icon
Event
Green circle with arrow left
Facility In
Black circle with arrow right
Facility Out
Purple circle
LPR (License Plate Read)
Red truck
Scale
Green star
Valve
Navy document
Ticket
Gold triangle
Alert
5.4 Row Type
Choose how transactions are grouped in the table:
multi: Groups all transactions for each vehicle on a single row. Use this to see a vehicle's complete activity for the day at a glance.
single: Displays each transaction on its own row, ordered by time. Use this for a chronological view of all activity.
Row type options
5.5 Table Options
Event View
basic: Show only key events (Facility In, Scale, Ticket, Facility Out)
all: Show all events in the transaction
Event view options
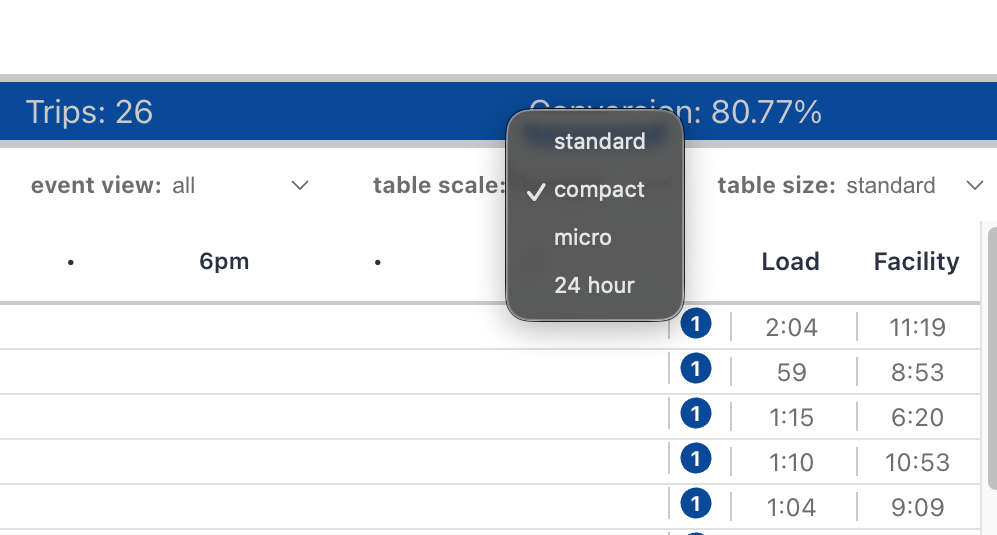
Table Scale
24 hour: Compressed view showing the entire day on screen
standard: Balanced view with clear time labels
compact: Slightly compressed for more transactions on screen
micro: Most detailed zoom level
Table scale options
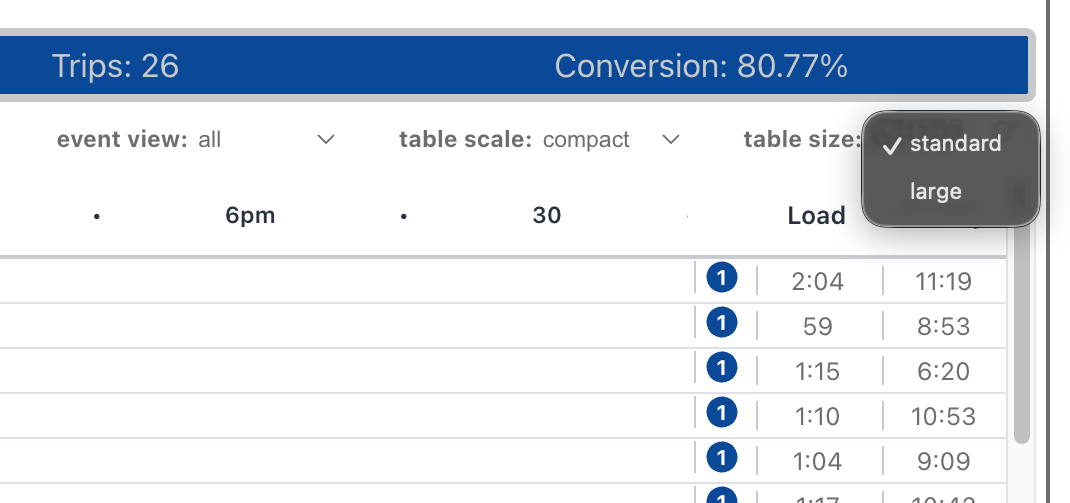
Table Size
standard: Default view with all controls visible
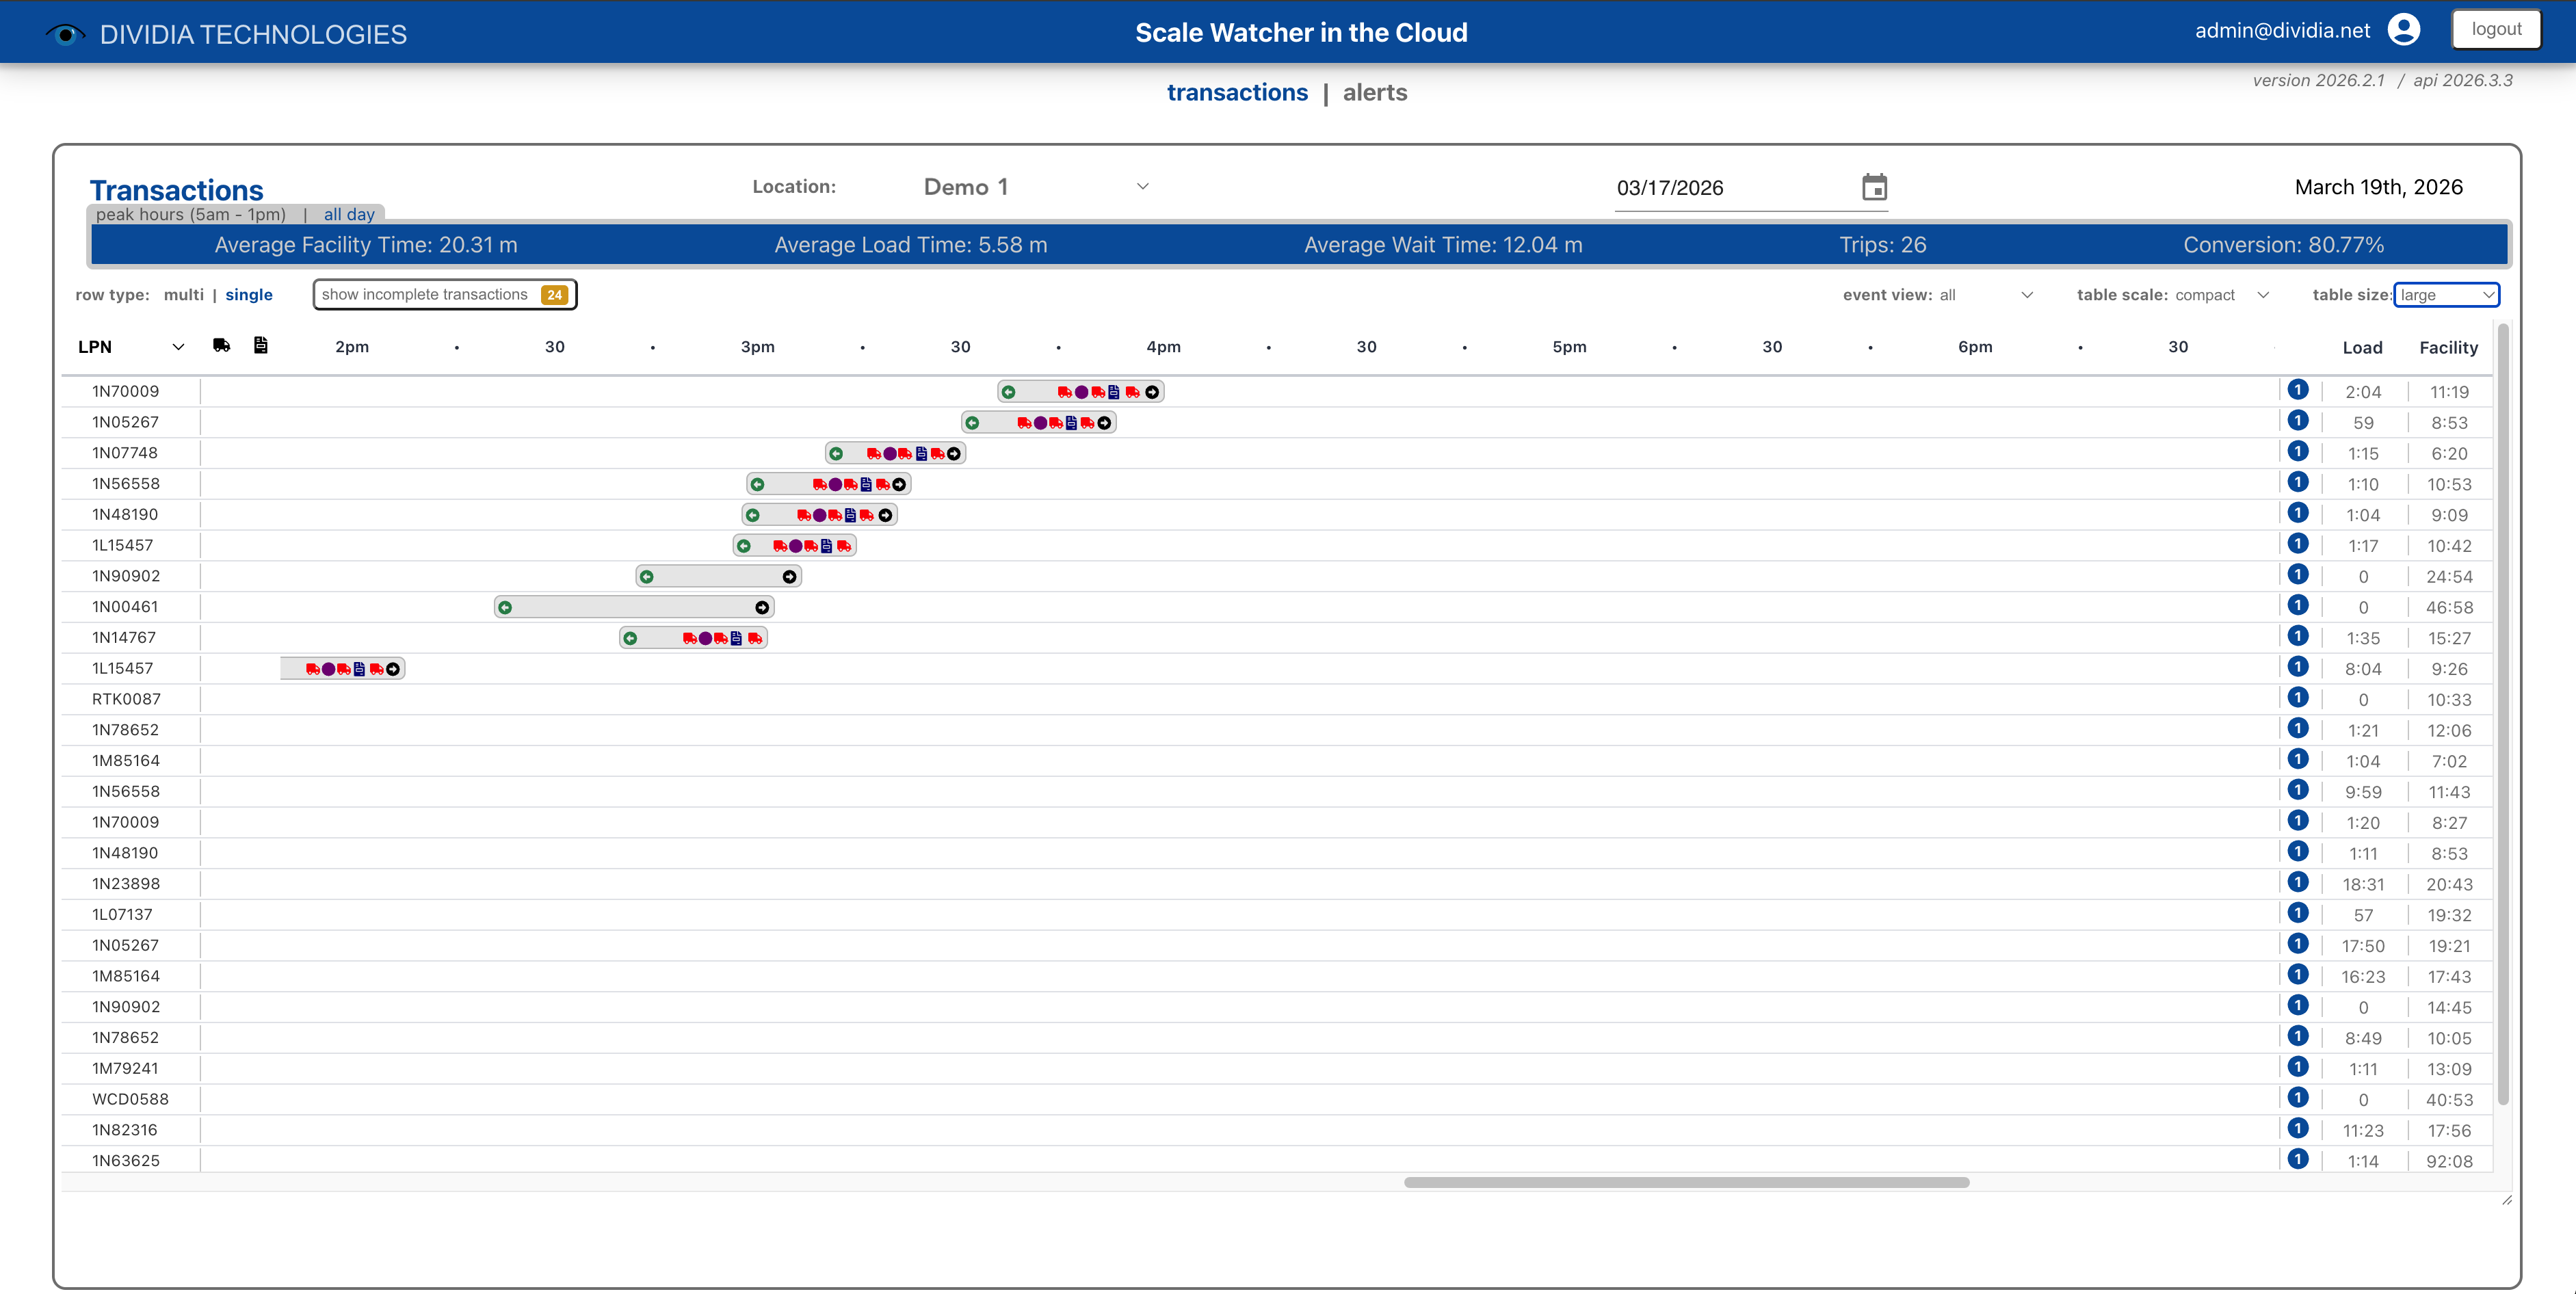
large: Expanded table with more rows visible
Table size options
Transaction view with large table size selected
5.6 Organizer
Choose how to identify rows in the table:
LPN: Organize by license plate number (default for Facility / LPR customer type)
Ticket: Organize by ticket number
Truck: Organize by truck identifier (default for Truck customer type)
Note: Available organizer options vary based on your site configuration (Facility/LPR tracking vs. standard Truck tracking).
5.7 Reading Transaction Data
Each row in the transaction table represents either a vehicle (multi mode) or a single transaction (single mode).
Timeline
Events appear as icons positioned along the timeline according to when they occurred. The colored bar surrounding events shows the duration of the transaction.
Event Tooltip
Hover over any event icon to see detailed information about that event, including timestamp and data values.
Trip Count
The number badge shows how many transactions that vehicle completed on the selected date.
Load / Facility Columns
Load: Time spent at the scale (from Scale Truck Entering to Scale Truck Leaving)
Facility: Total time in facility (from Facility In to Facility Out)
Viewing Details
Click any event or transaction to open the Transaction Gallery View with complete details.
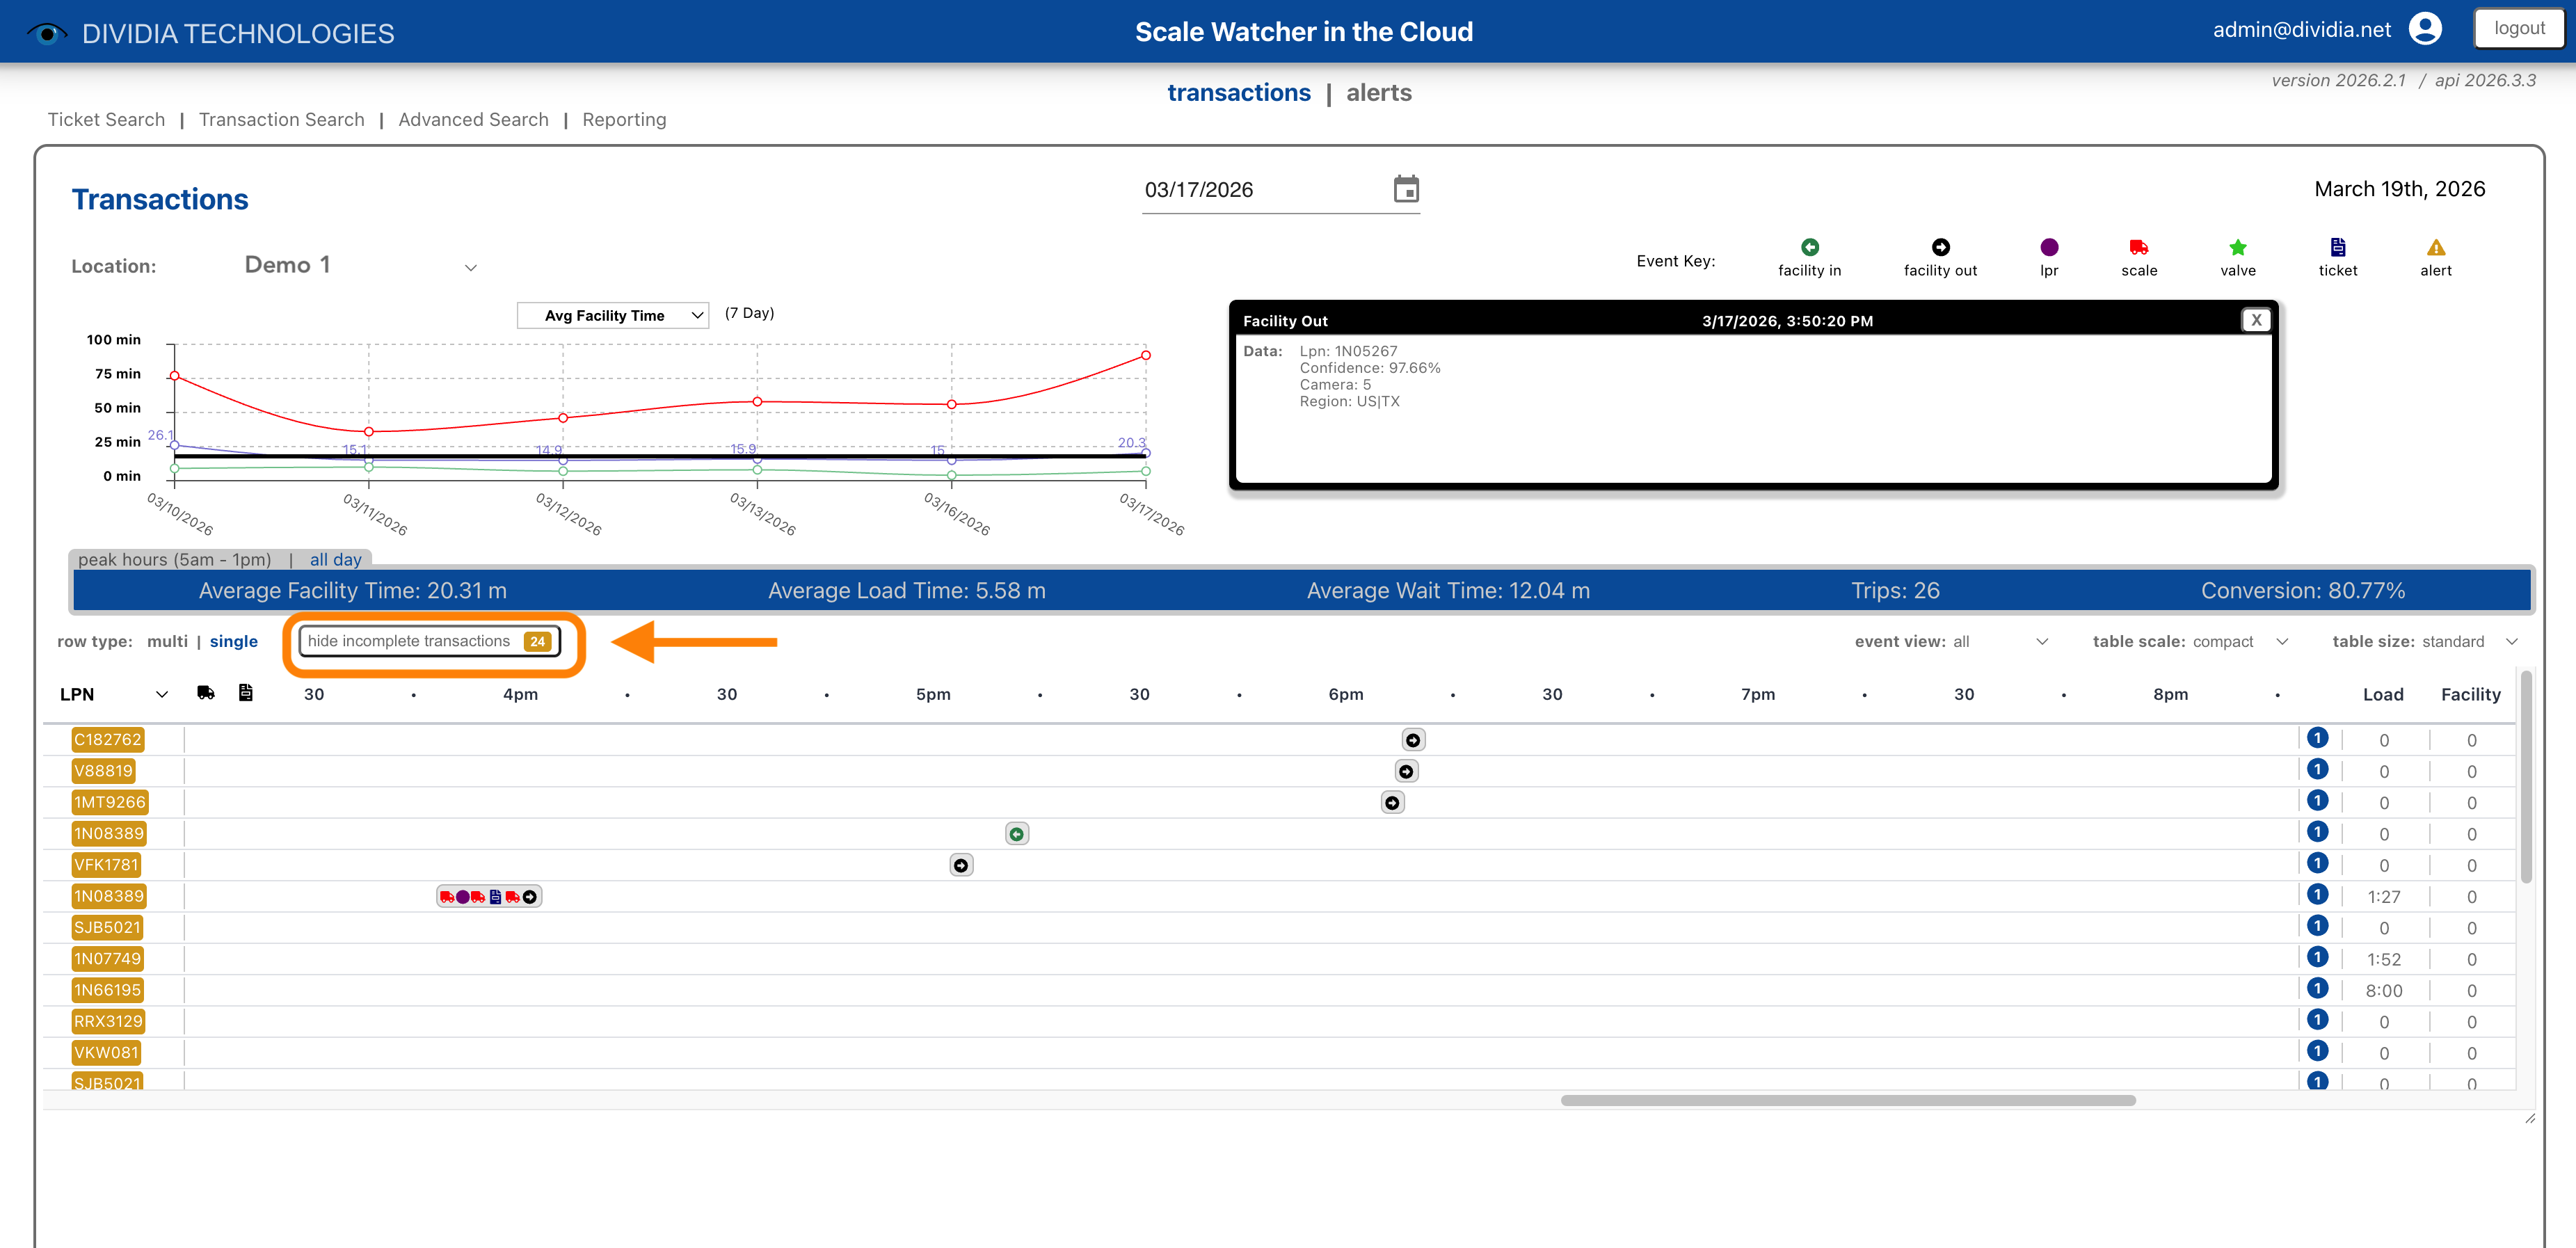
5.8 Incomplete Transactions
When viewing in single row mode, you can toggle visibility of incomplete transactions:
Showing incomplete transactions
Click show incomplete transactions to include transactions that are missing key events (such as a vehicle that was ticketed, but a license plate was not read upon entering the facility). The badge shows how many incomplete transactions exist.
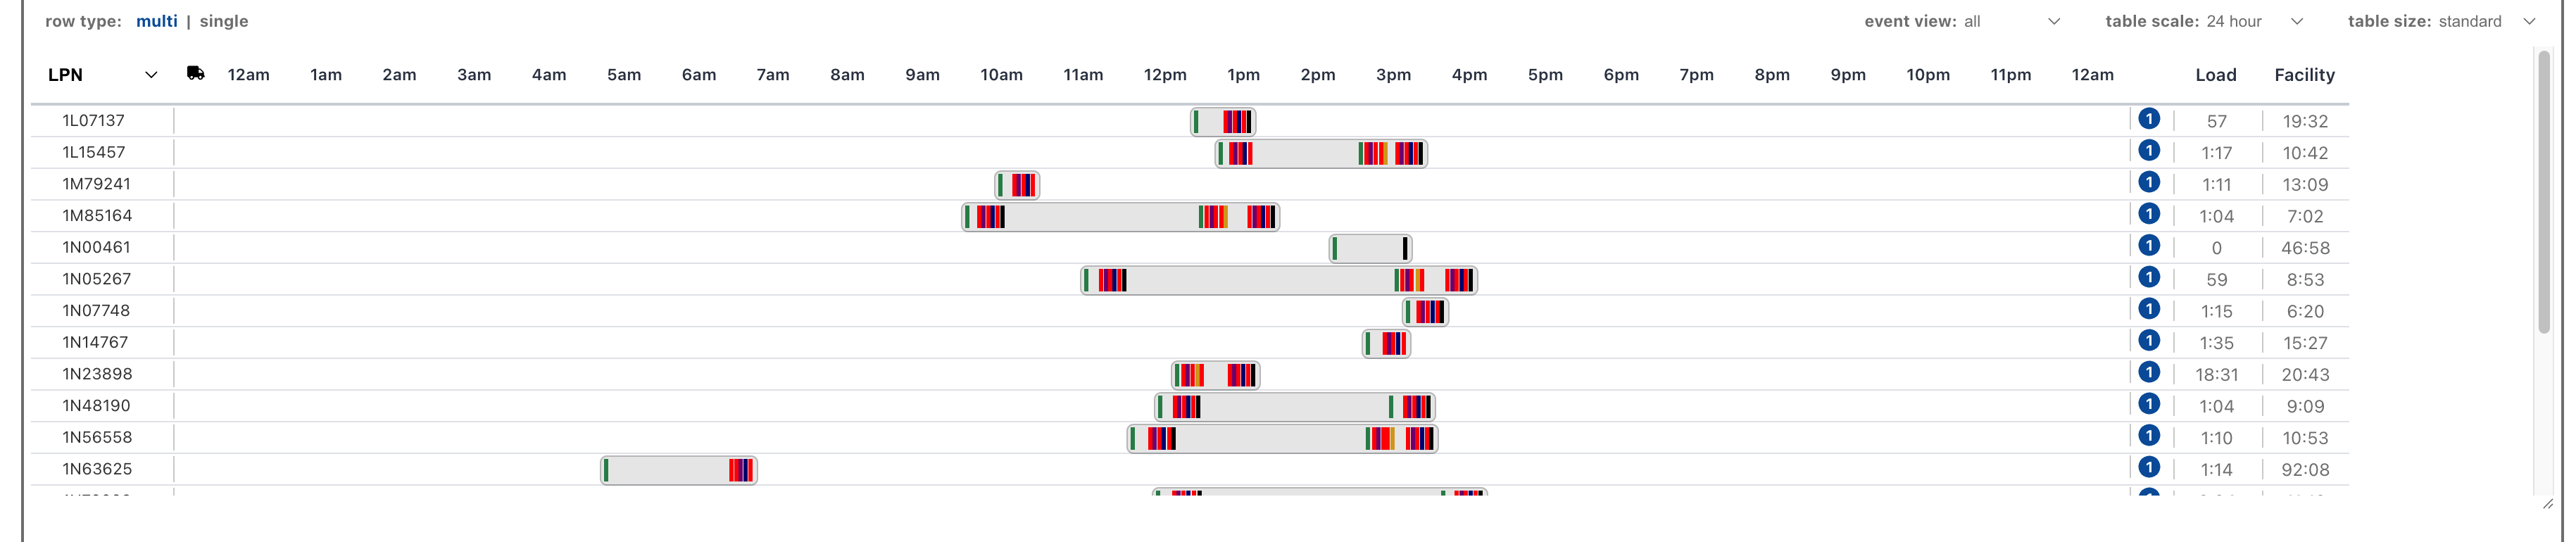
5.9 24-Hour View
The 24-hour table scale provides a full-day overview:
24-hour timeline view showing all daily activity
This view is useful for:
Seeing overall daily patterns
Identifying busy periods
Spotting vehicles with unusually long facility times
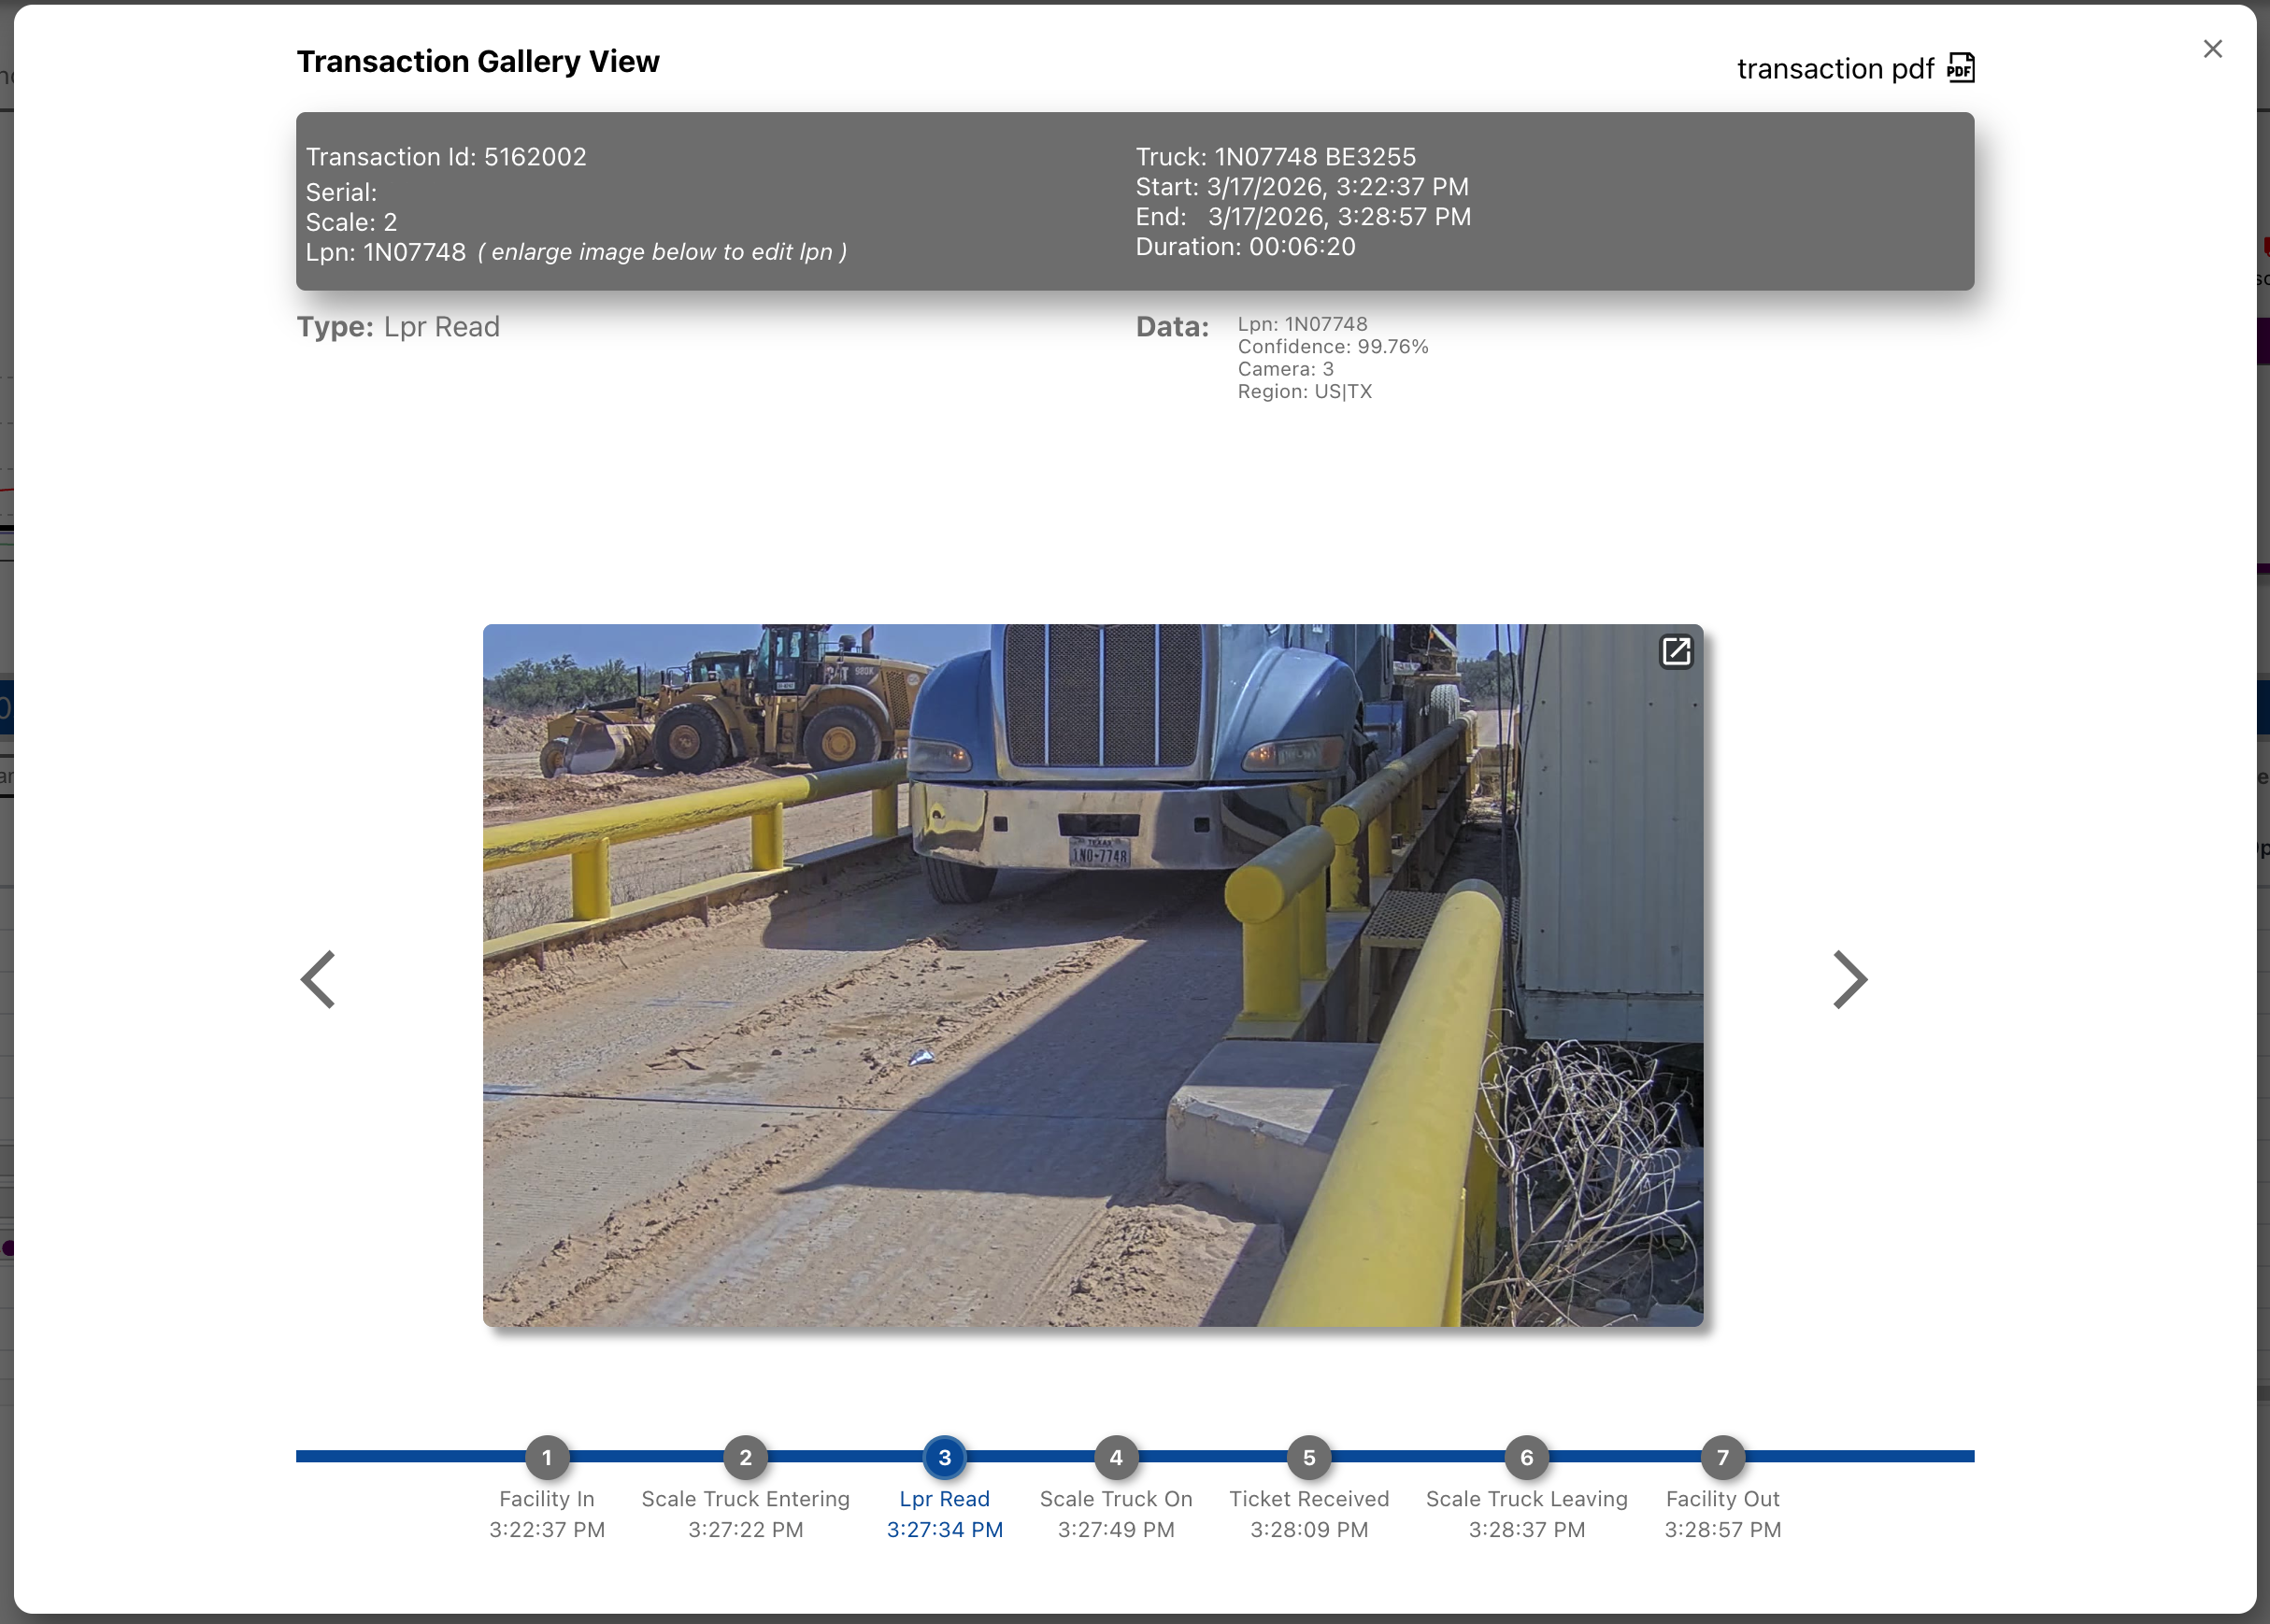
6. Transaction Gallery View
The Transaction Gallery View provides a detailed look at a single transaction, showing all events with their associated images and data.
Transaction Gallery View
6.1 Accessing the Gallery
Click any event or transaction row in the Transaction View to open the Gallery.
6.2 Gallery Elements
Transaction Information
The header shows key transaction details:
Transaction ID and Serial number
LPN (License Plate Number)
Truck identifier
Start and end times
Total duration
Scale number
Event Type and Data
The current event's type is displayed along with its associated data. For ticket events, this includes customer, product, weight, carrier, and ticket number etc.
Event Images
Images captured during the event are displayed. Click an image to enlarge it. Use the expand icon to view full-screen.
Timeline Navigation
The timeline at the bottom shows all events in the transaction. The current event is highlighted. Click any event to jump to it, or use the arrow buttons to move forward and backward.
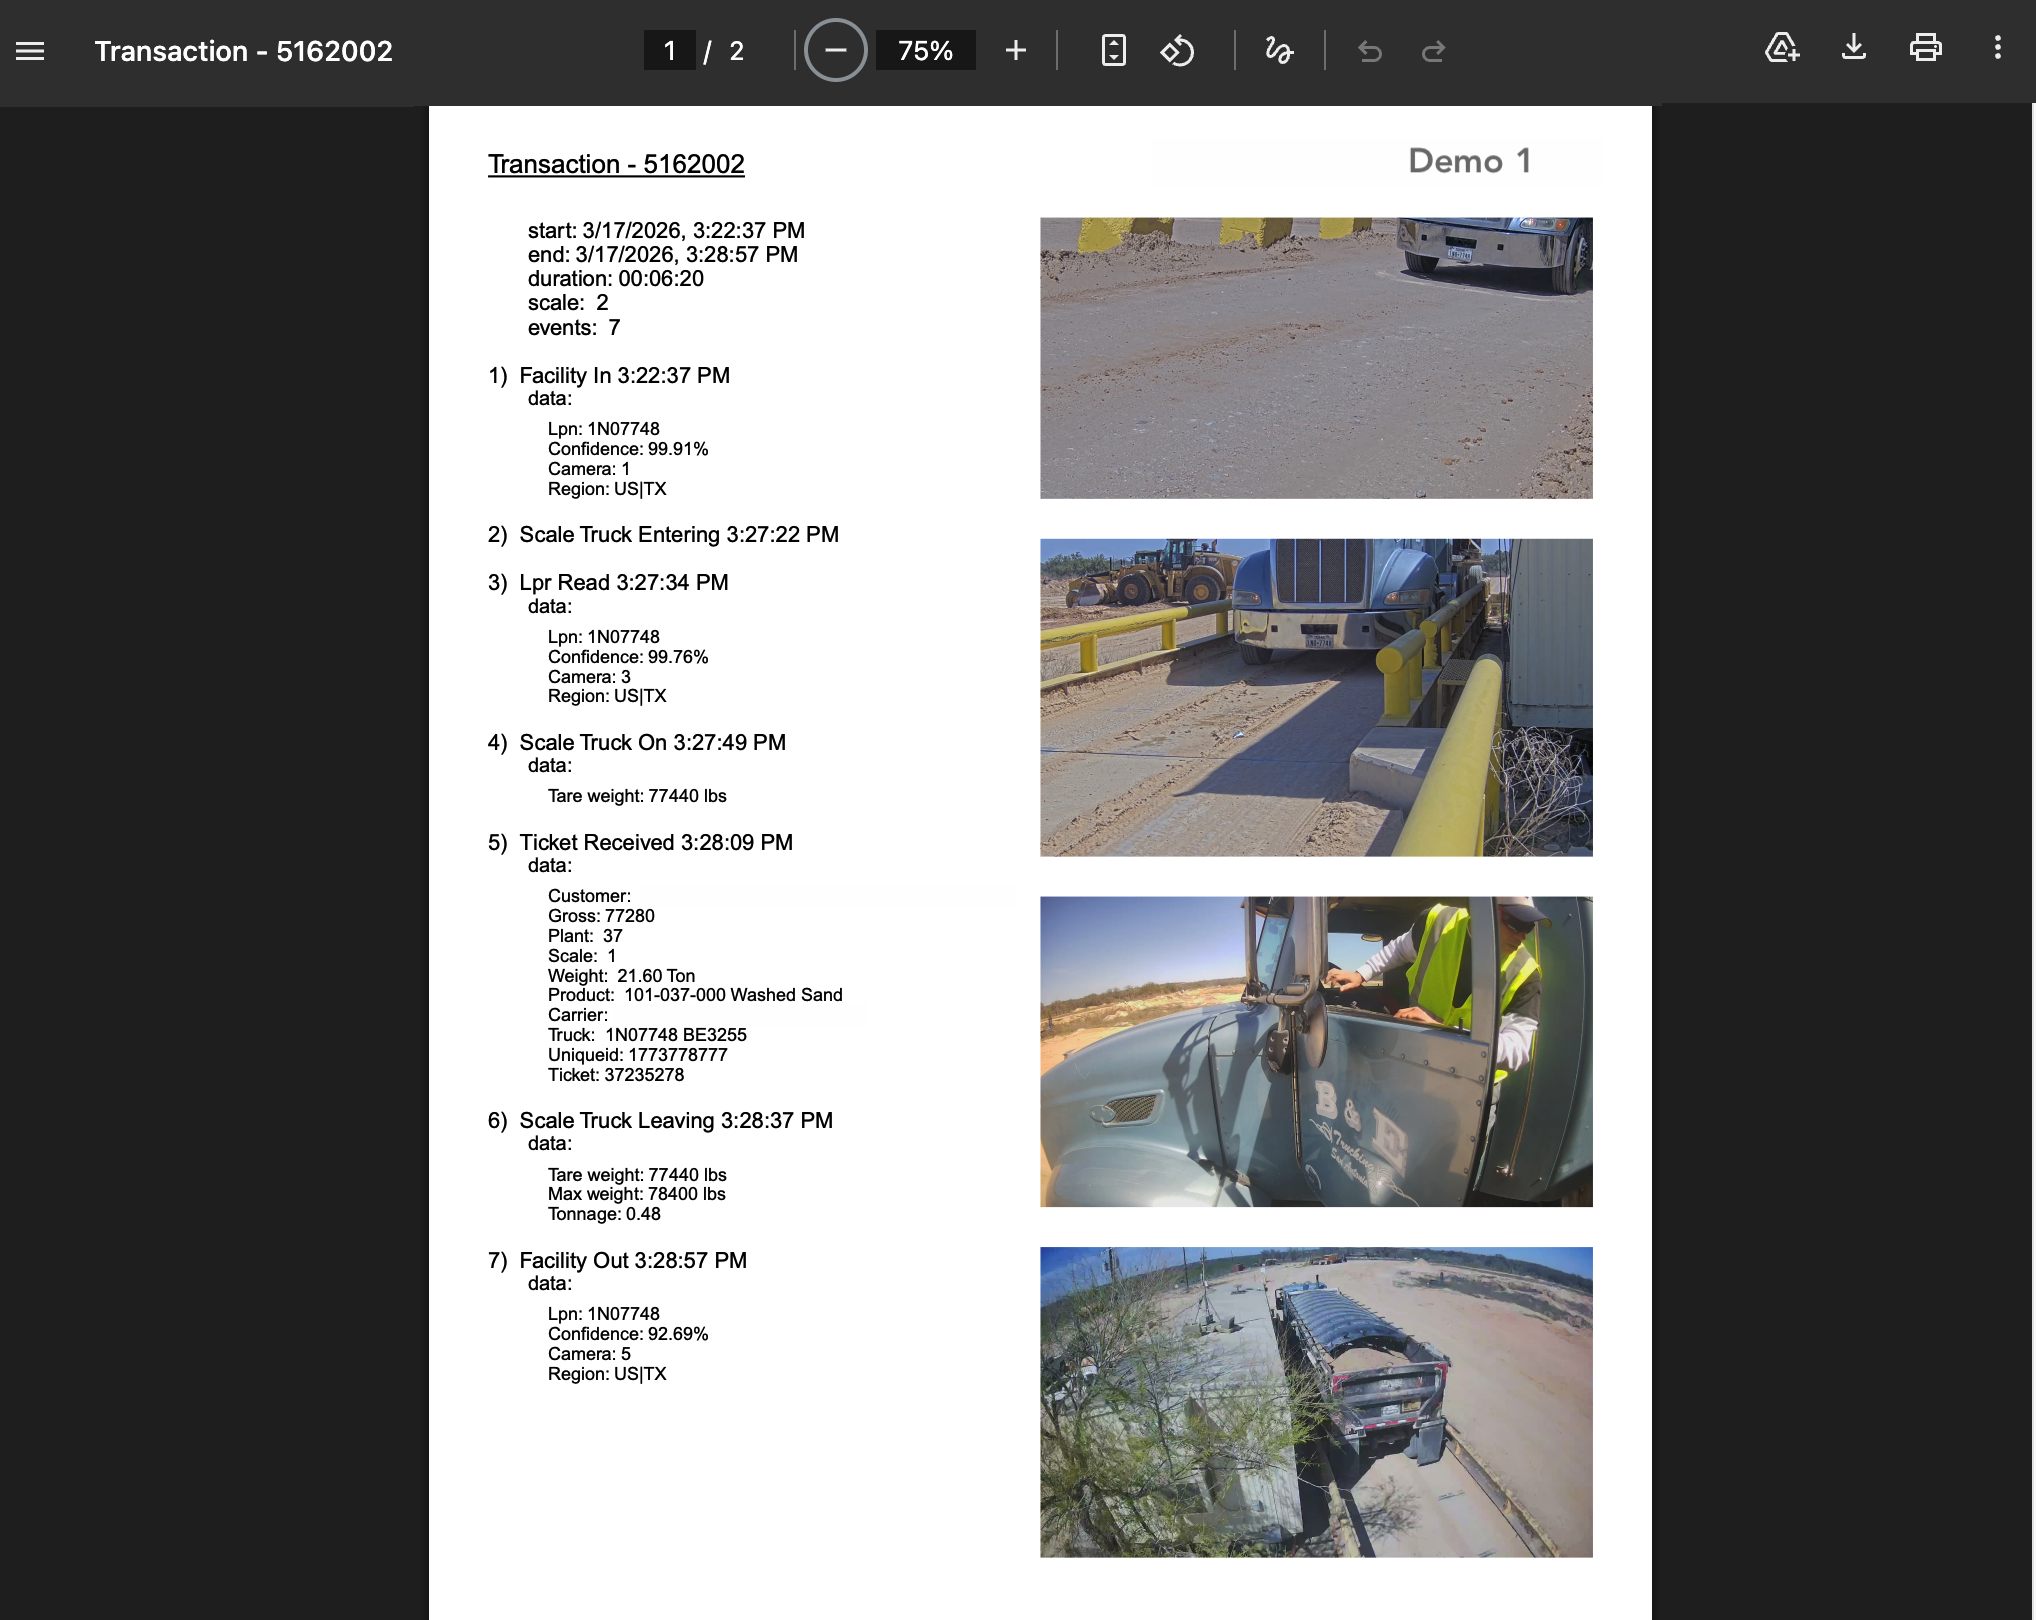
6.3 PDF Export
Click transaction pdf to view the transaction as a formatted PDF document.
Transaction PDF view
The PDF includes:
Complete transaction summary
All event details with timestamps
Images from each event
Use the PDF toolbar to:
Print: Send to a printer
Download: Save as a PDF file
Zoom: Adjust the view size
This PDF serves as official documentation for the transaction and can be shared for dispute resolution or audit purposes.
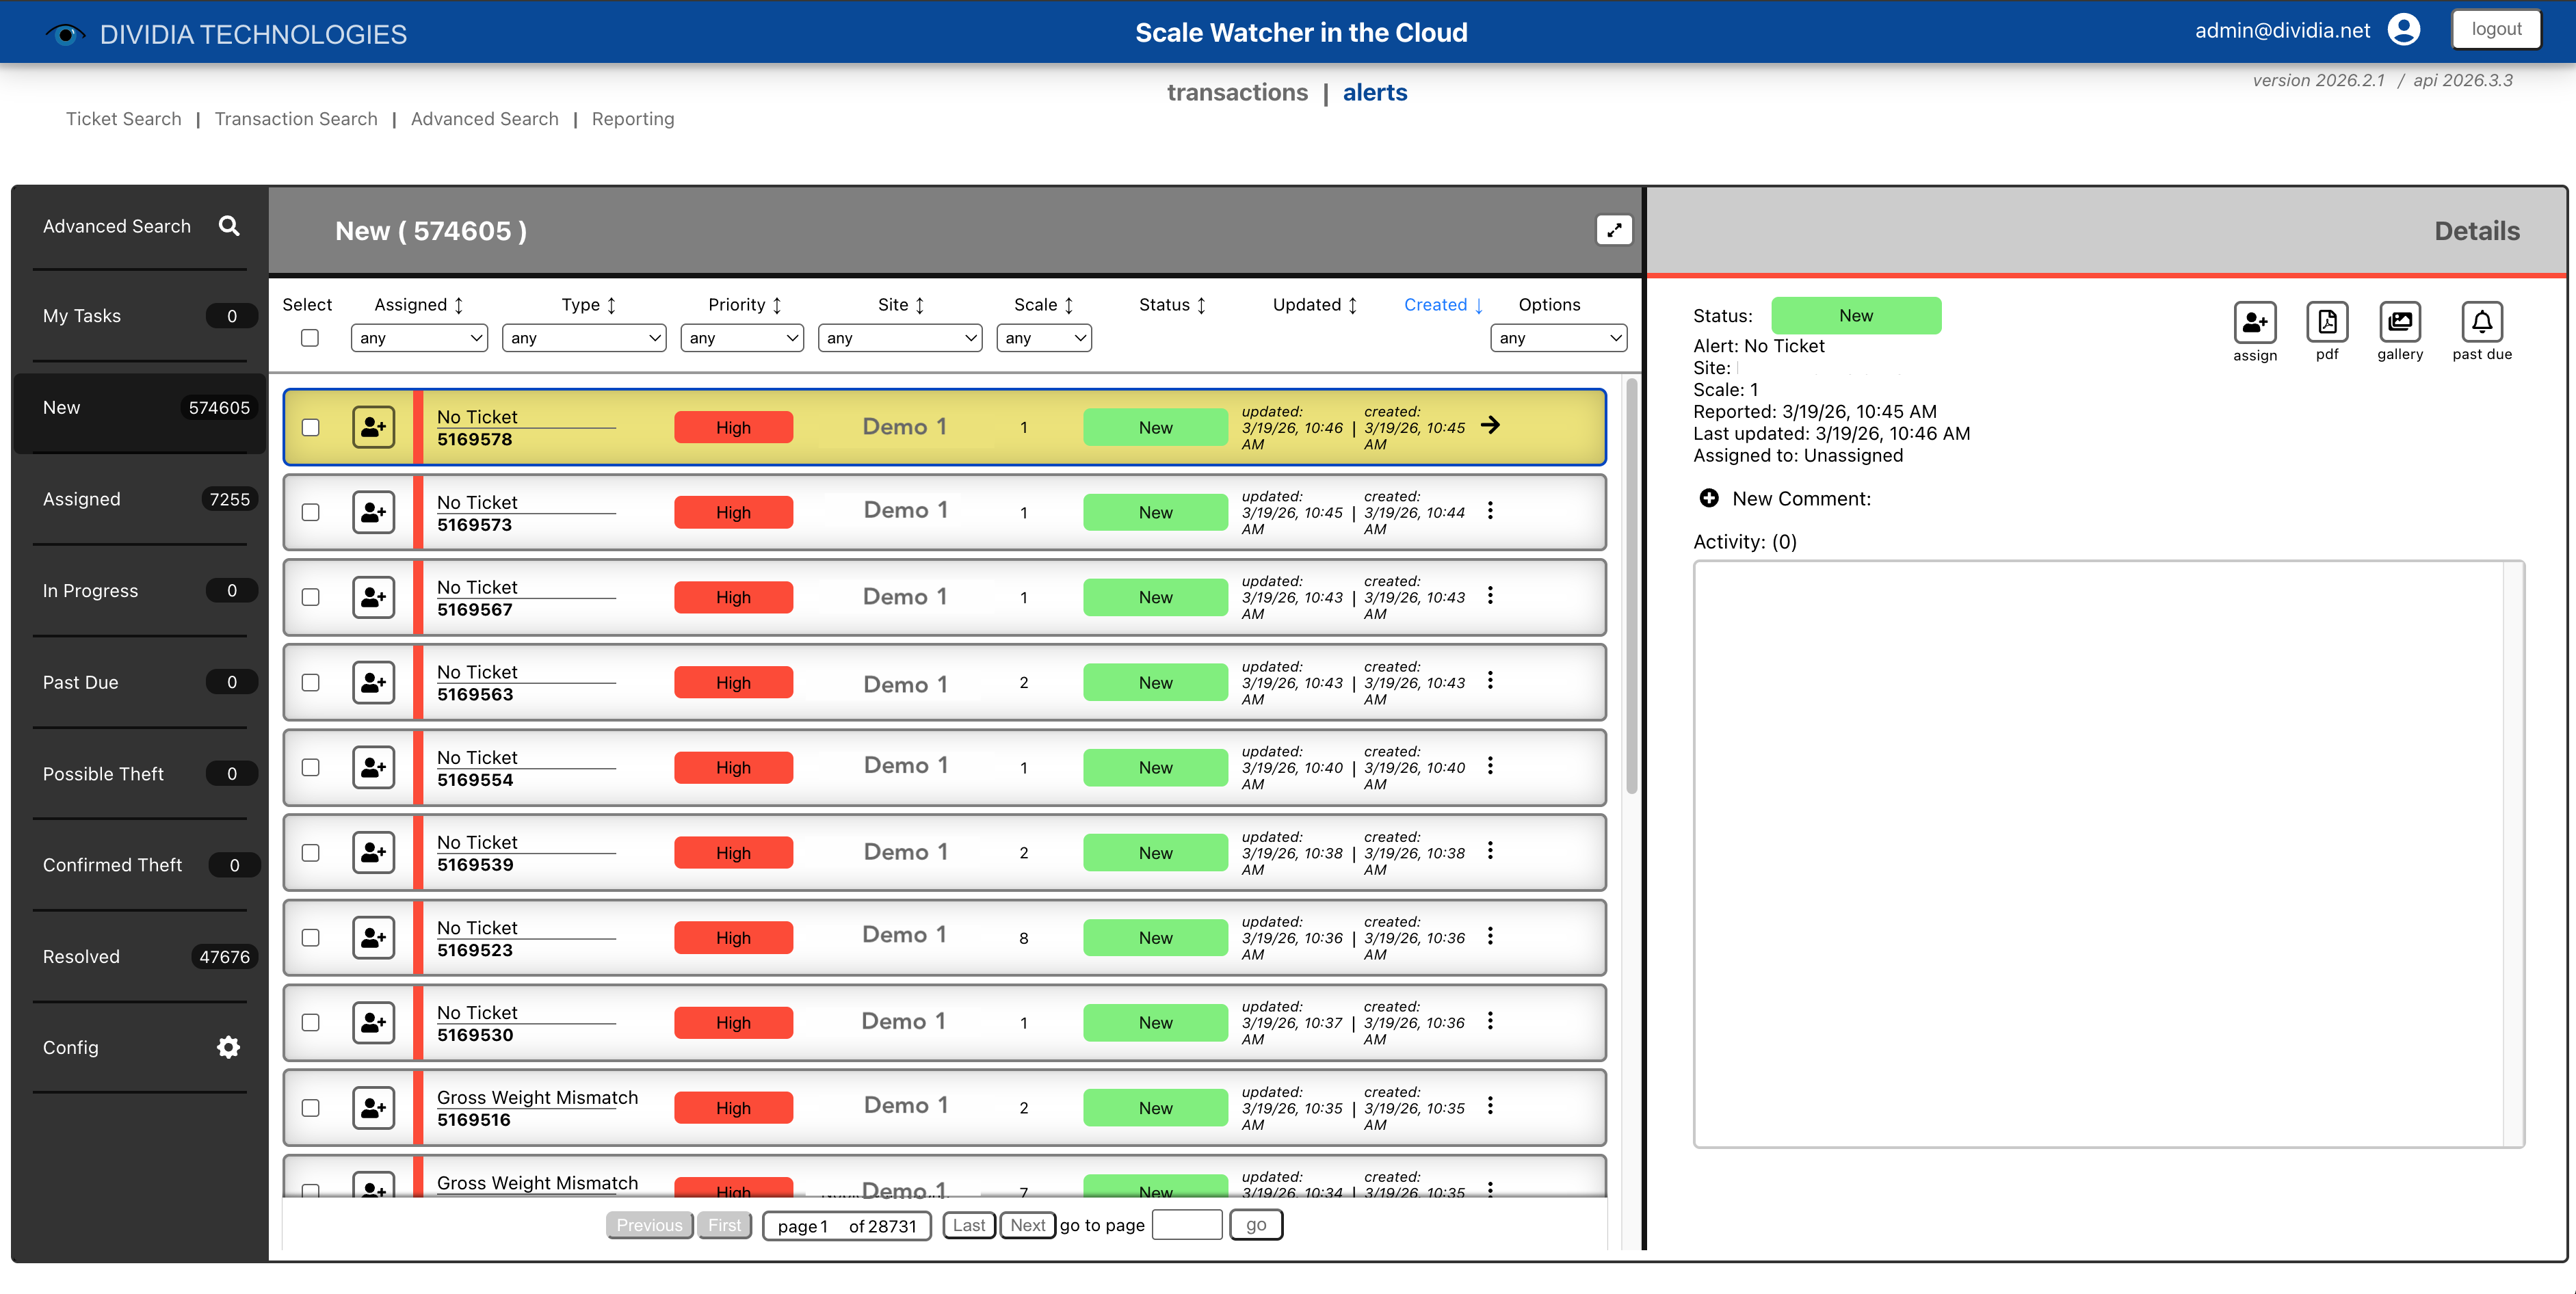
7. Alert View
The Alert View helps you monitor and respond to operational anomalies. When ScaleWatcher detects a transaction that falls outside normal parameters, it creates an alert for review.
Note: Alert reporting must be configured on the on-premise NVR prior to receiving cloud alerts.
Alert View showing open alerts
7.1 Alert Types
ScaleWatcher is able to monitor for the following conditions:
Alert Type
Description
No Ticket
Vehicle loaded and left the scale without a ticket being printed
Overweight
Vehicle exceeds the maximum weight threshold
Weight Mismatch
Ticket weight doesn't match the scale weight reading
Tare Contamination
Vehicle weight is too high before loading (possible contamination or pre-loaded material)
Valve Alert
Loading valve closed without a ticket being printed
Manual Ticket
Ticket was entered manually rather than from the scale system
Scale Connection
Communication with the scale was lost or restored
Waste Ticket
Waste material ticket was generated
Scale Data Fail
Failed to capture scale data for this transaction
Valve Data Fail
Failed to capture valve data for this transaction
7.2 Alert Navigation
The left sidebar provides quick access to alerts organized by status:
My Tasks: Alerts assigned to you that need action
New: Unassigned alerts requiring review
Assigned: Alerts assigned to users
In Progress: Alerts currently being worked
Past Due: Alerts that have exceeded their resolution timeframe
Possible Theft: Transactions flagged as potential theft
Confirmed Theft: Transactions confirmed as theft
Resolved: Completed alerts
Config: Alert configuration settings (admin only)
The badge next to each status shows the count of alerts in that category.
7.3 Alert List
The main area displays alerts matching your current filter. Each row shows:
Checkbox: Select for bulk operations
Status: Current alert status (dropdown to change)
Flag: Mark important alerts
Type: The alert type
Priority: High (red), Medium (gold), or Low (gray)
Serial/Site: The site where the alert occurred
Scale: Which scale generated the alert
Reported At: When the alert was created
Updated: Last modification time
View Trans.: Button to view the associated transaction
7.4 Alert Details Panel
Click an alert row to view its details in the right panel:
Status: Current status with option to change
Alert Type: The type of anomaly detected
Scale: Which scale was involved
Reported/Updated: Timestamps
Assigned To: Who is responsible for this alert
Activity Log: History of actions taken on this alert
Adding Comments
Enter notes in the comment field and click to add. Comments are saved to the activity log and visible to all users.
Viewing the Transaction
Click the gallery, PDF, or details icons to view the associated transaction.
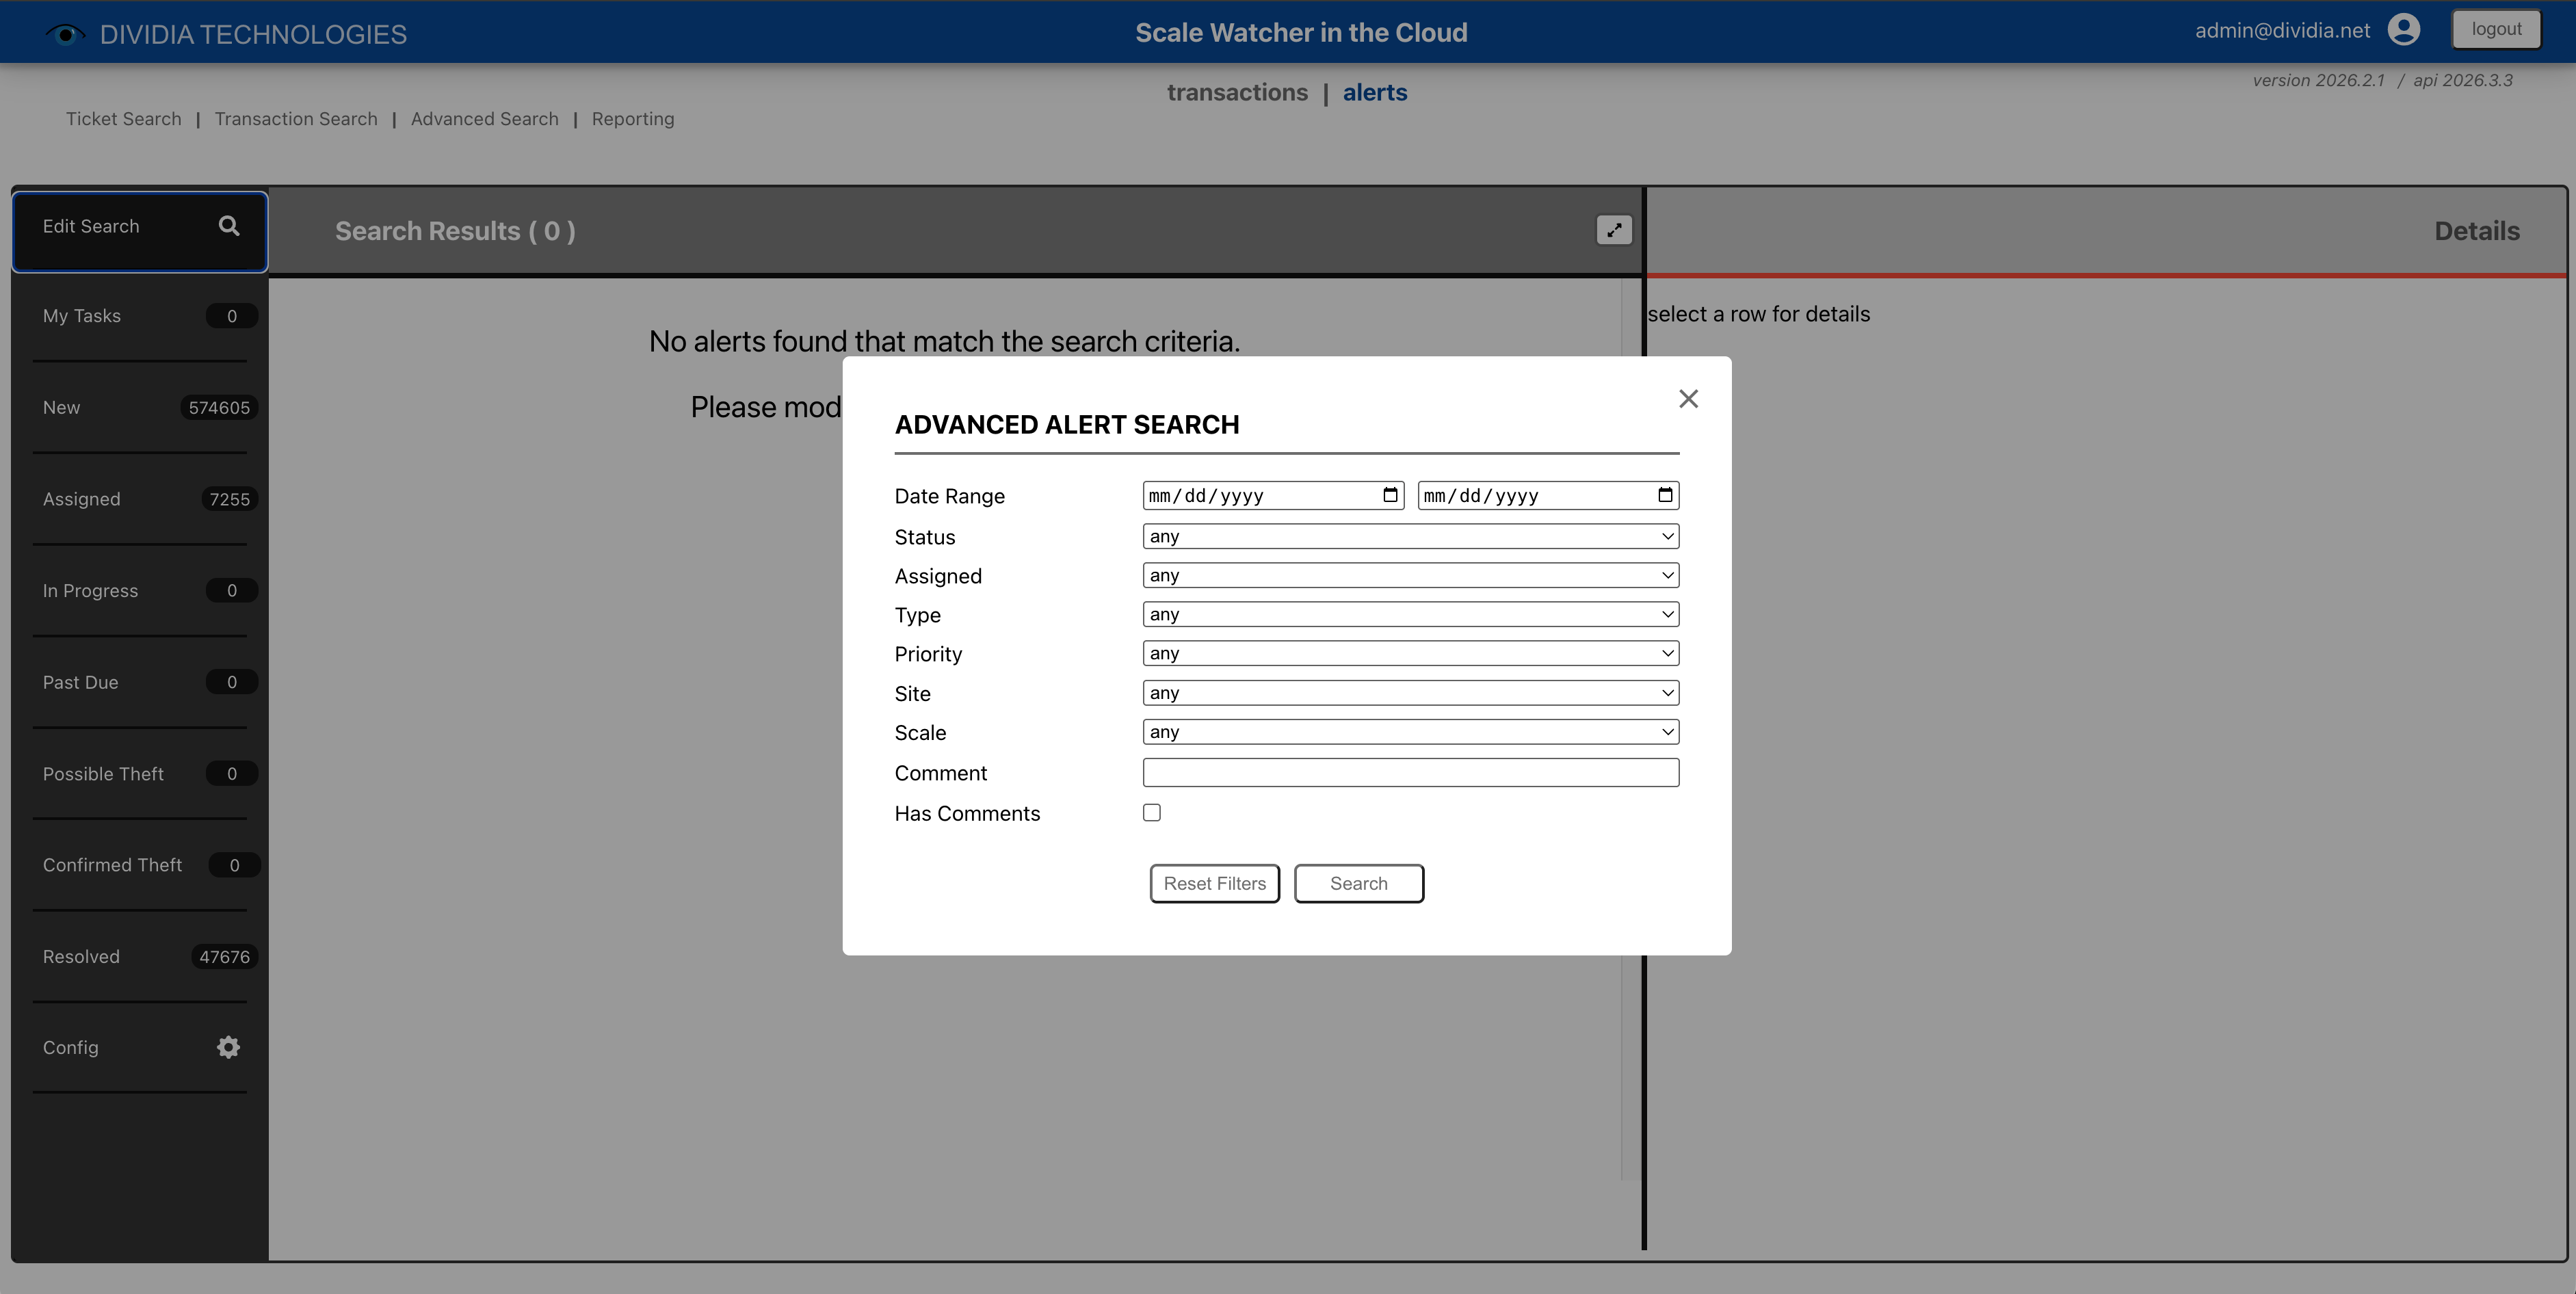
7.5 Searching Alerts
Click Edit Search to open the Advanced Alert Search dialog:
Advanced Alert Search dialog
Filter alerts by:
Date Range: When the alert was created
Status: New, Assigned, In Progress, etc.
Assigned: Which user is assigned
Type: Alert type
Priority: High, Medium, or Low
Site: Which facility
Scale: Which scale
Comment: Search within comments
Has Comments: Only alerts with comments
Click Search to apply filters. Results appear in the Search Results view.
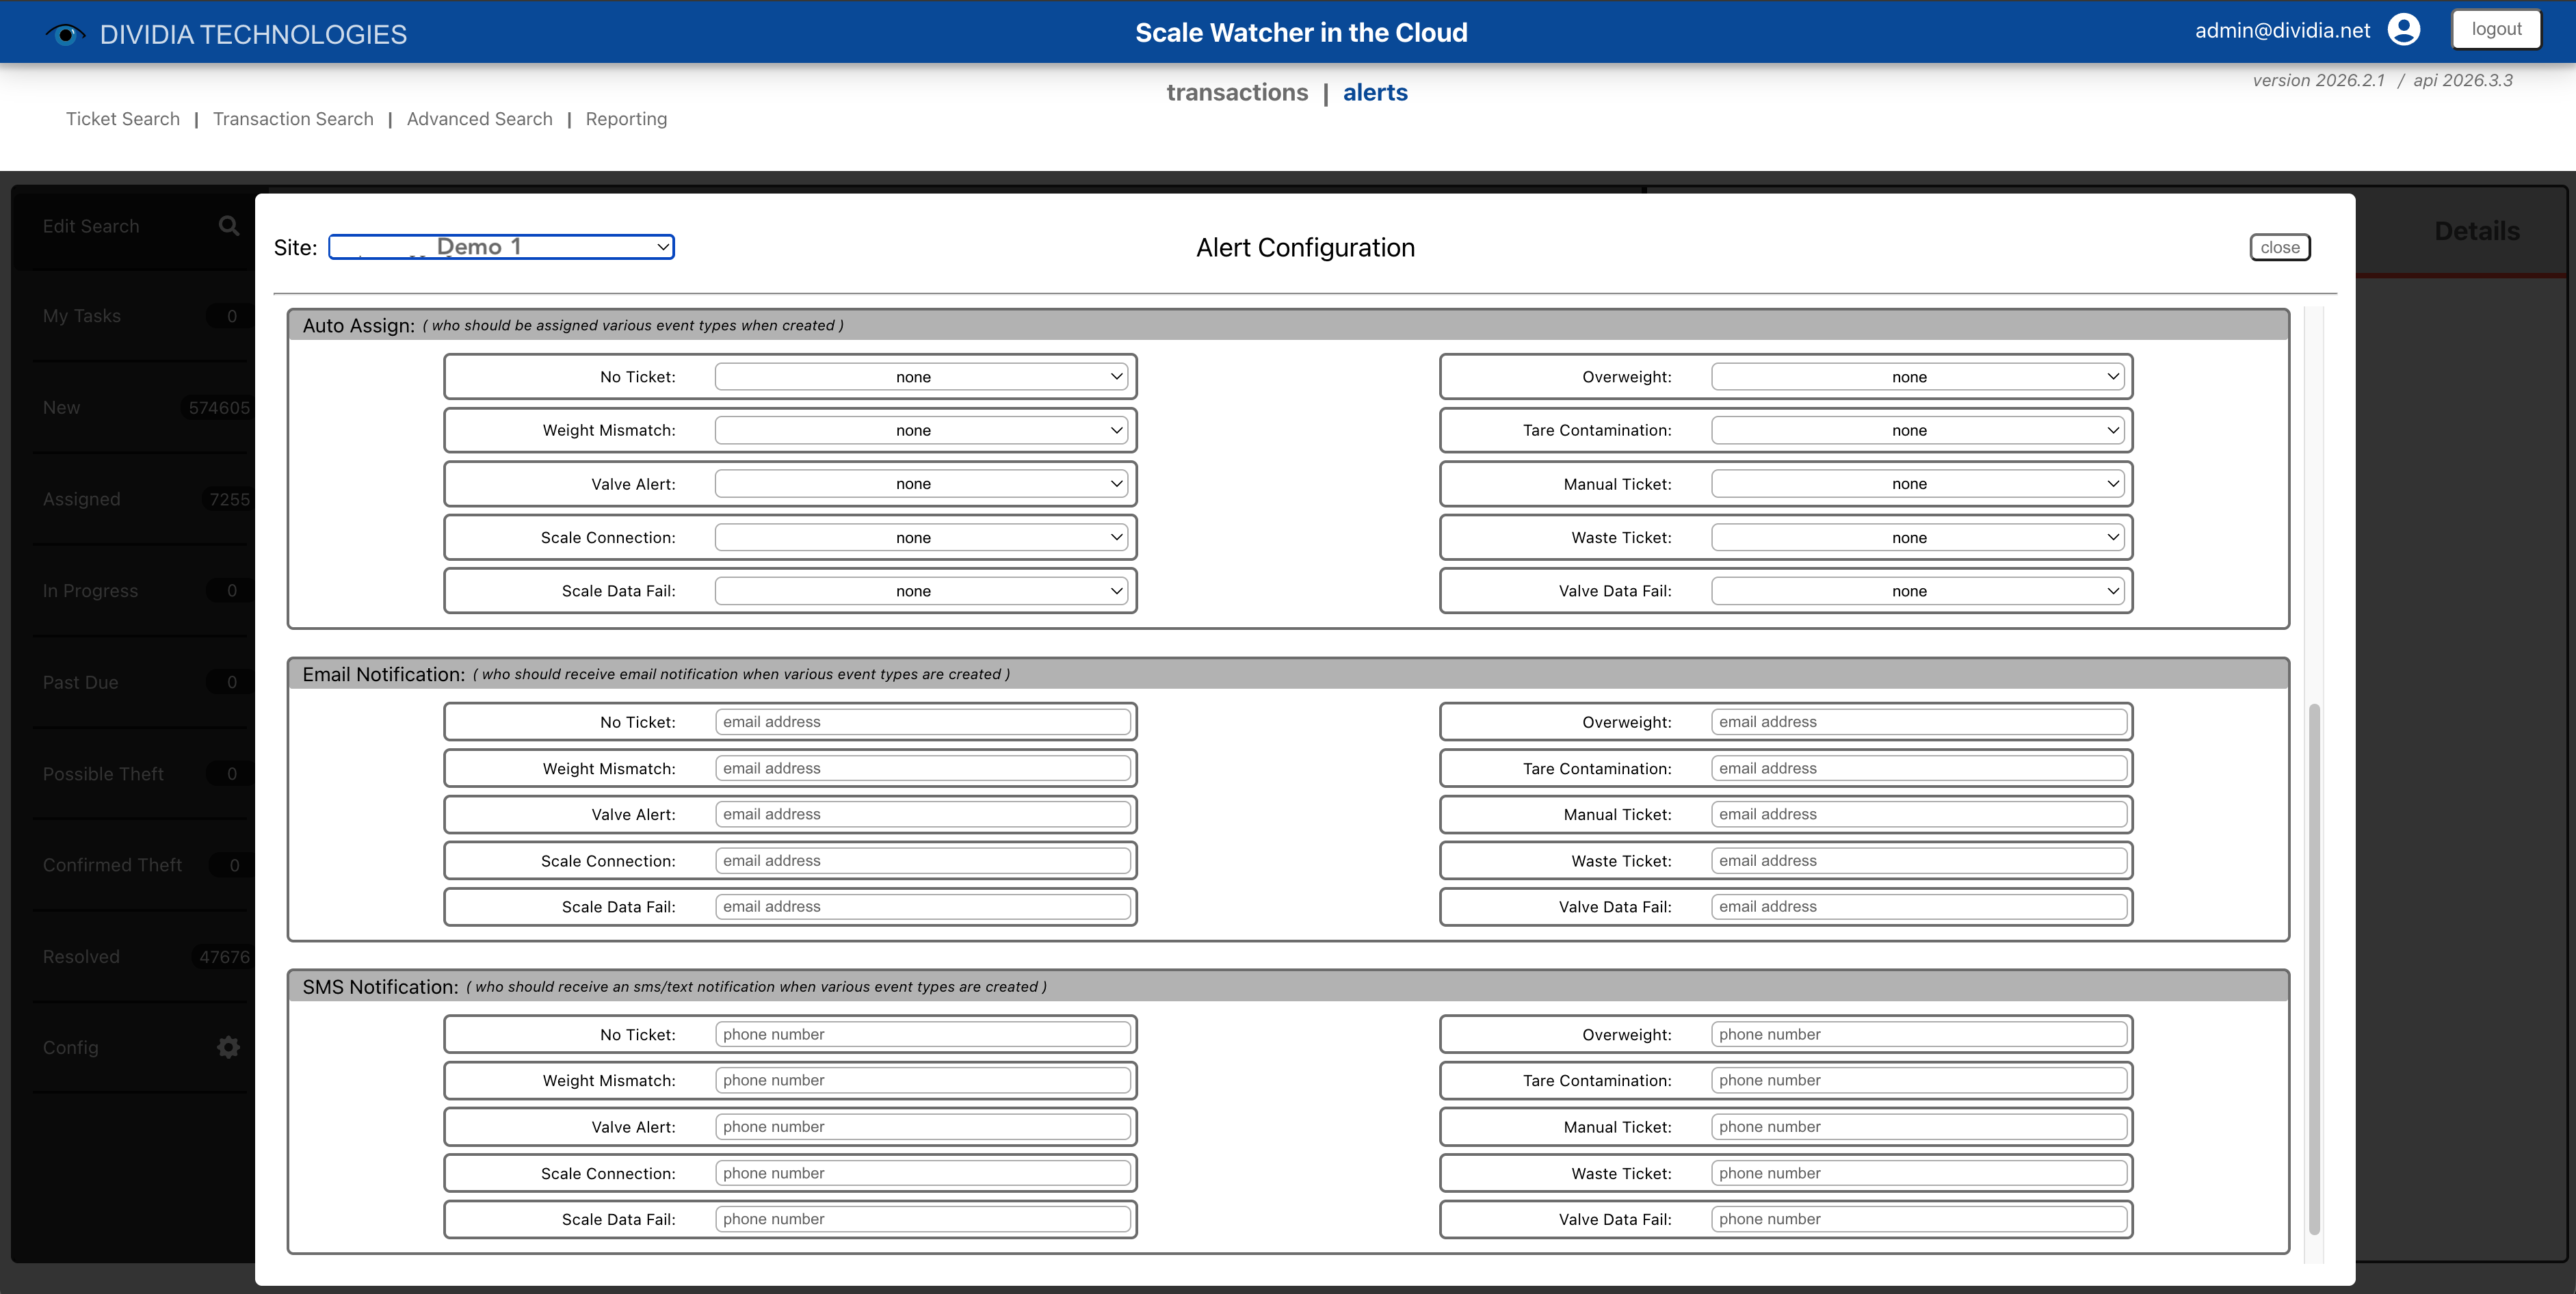
7.6 Alert Configuration (Admin)
Administrators can configure alert behavior by clicking Config in the sidebar. Each setting can be configured independently for each alert type.
Alert Configuration screen
Expiration (Past Due)
Set the number of days before an unresolved alert is marked as "Past Due." When an alert exceeds this threshold without being resolved, it appears in the Past Due section for follow-up. Default is 30 days.
Priority
Set the default priority level assigned to new alerts of each type:
High: Urgent alerts requiring immediate attention (displayed in red)
Medium: Important alerts that should be addressed soon (displayed in gold)
Low: Informational alerts for review when time permits (displayed in gray)
Auto Assign
Automatically assign new alerts of each type to a specific user. Select a user from the dropdown, or choose "none" for manual assignment.
Email Notification
Enter email addresses to receive notifications when alerts of each type are created. Notifications are sent immediately when a new alert is generated.
SMS Notification
Enter phone numbers to receive text message notifications for specific alert types. Simply enter the 10-digit phone number and the system will automatically format it as (XXX) XXX-XXXX.
8. Data Searching
ScaleWatcher Cloud provides multiple ways to find specific transactions / tickets.
8.1 Quick Search
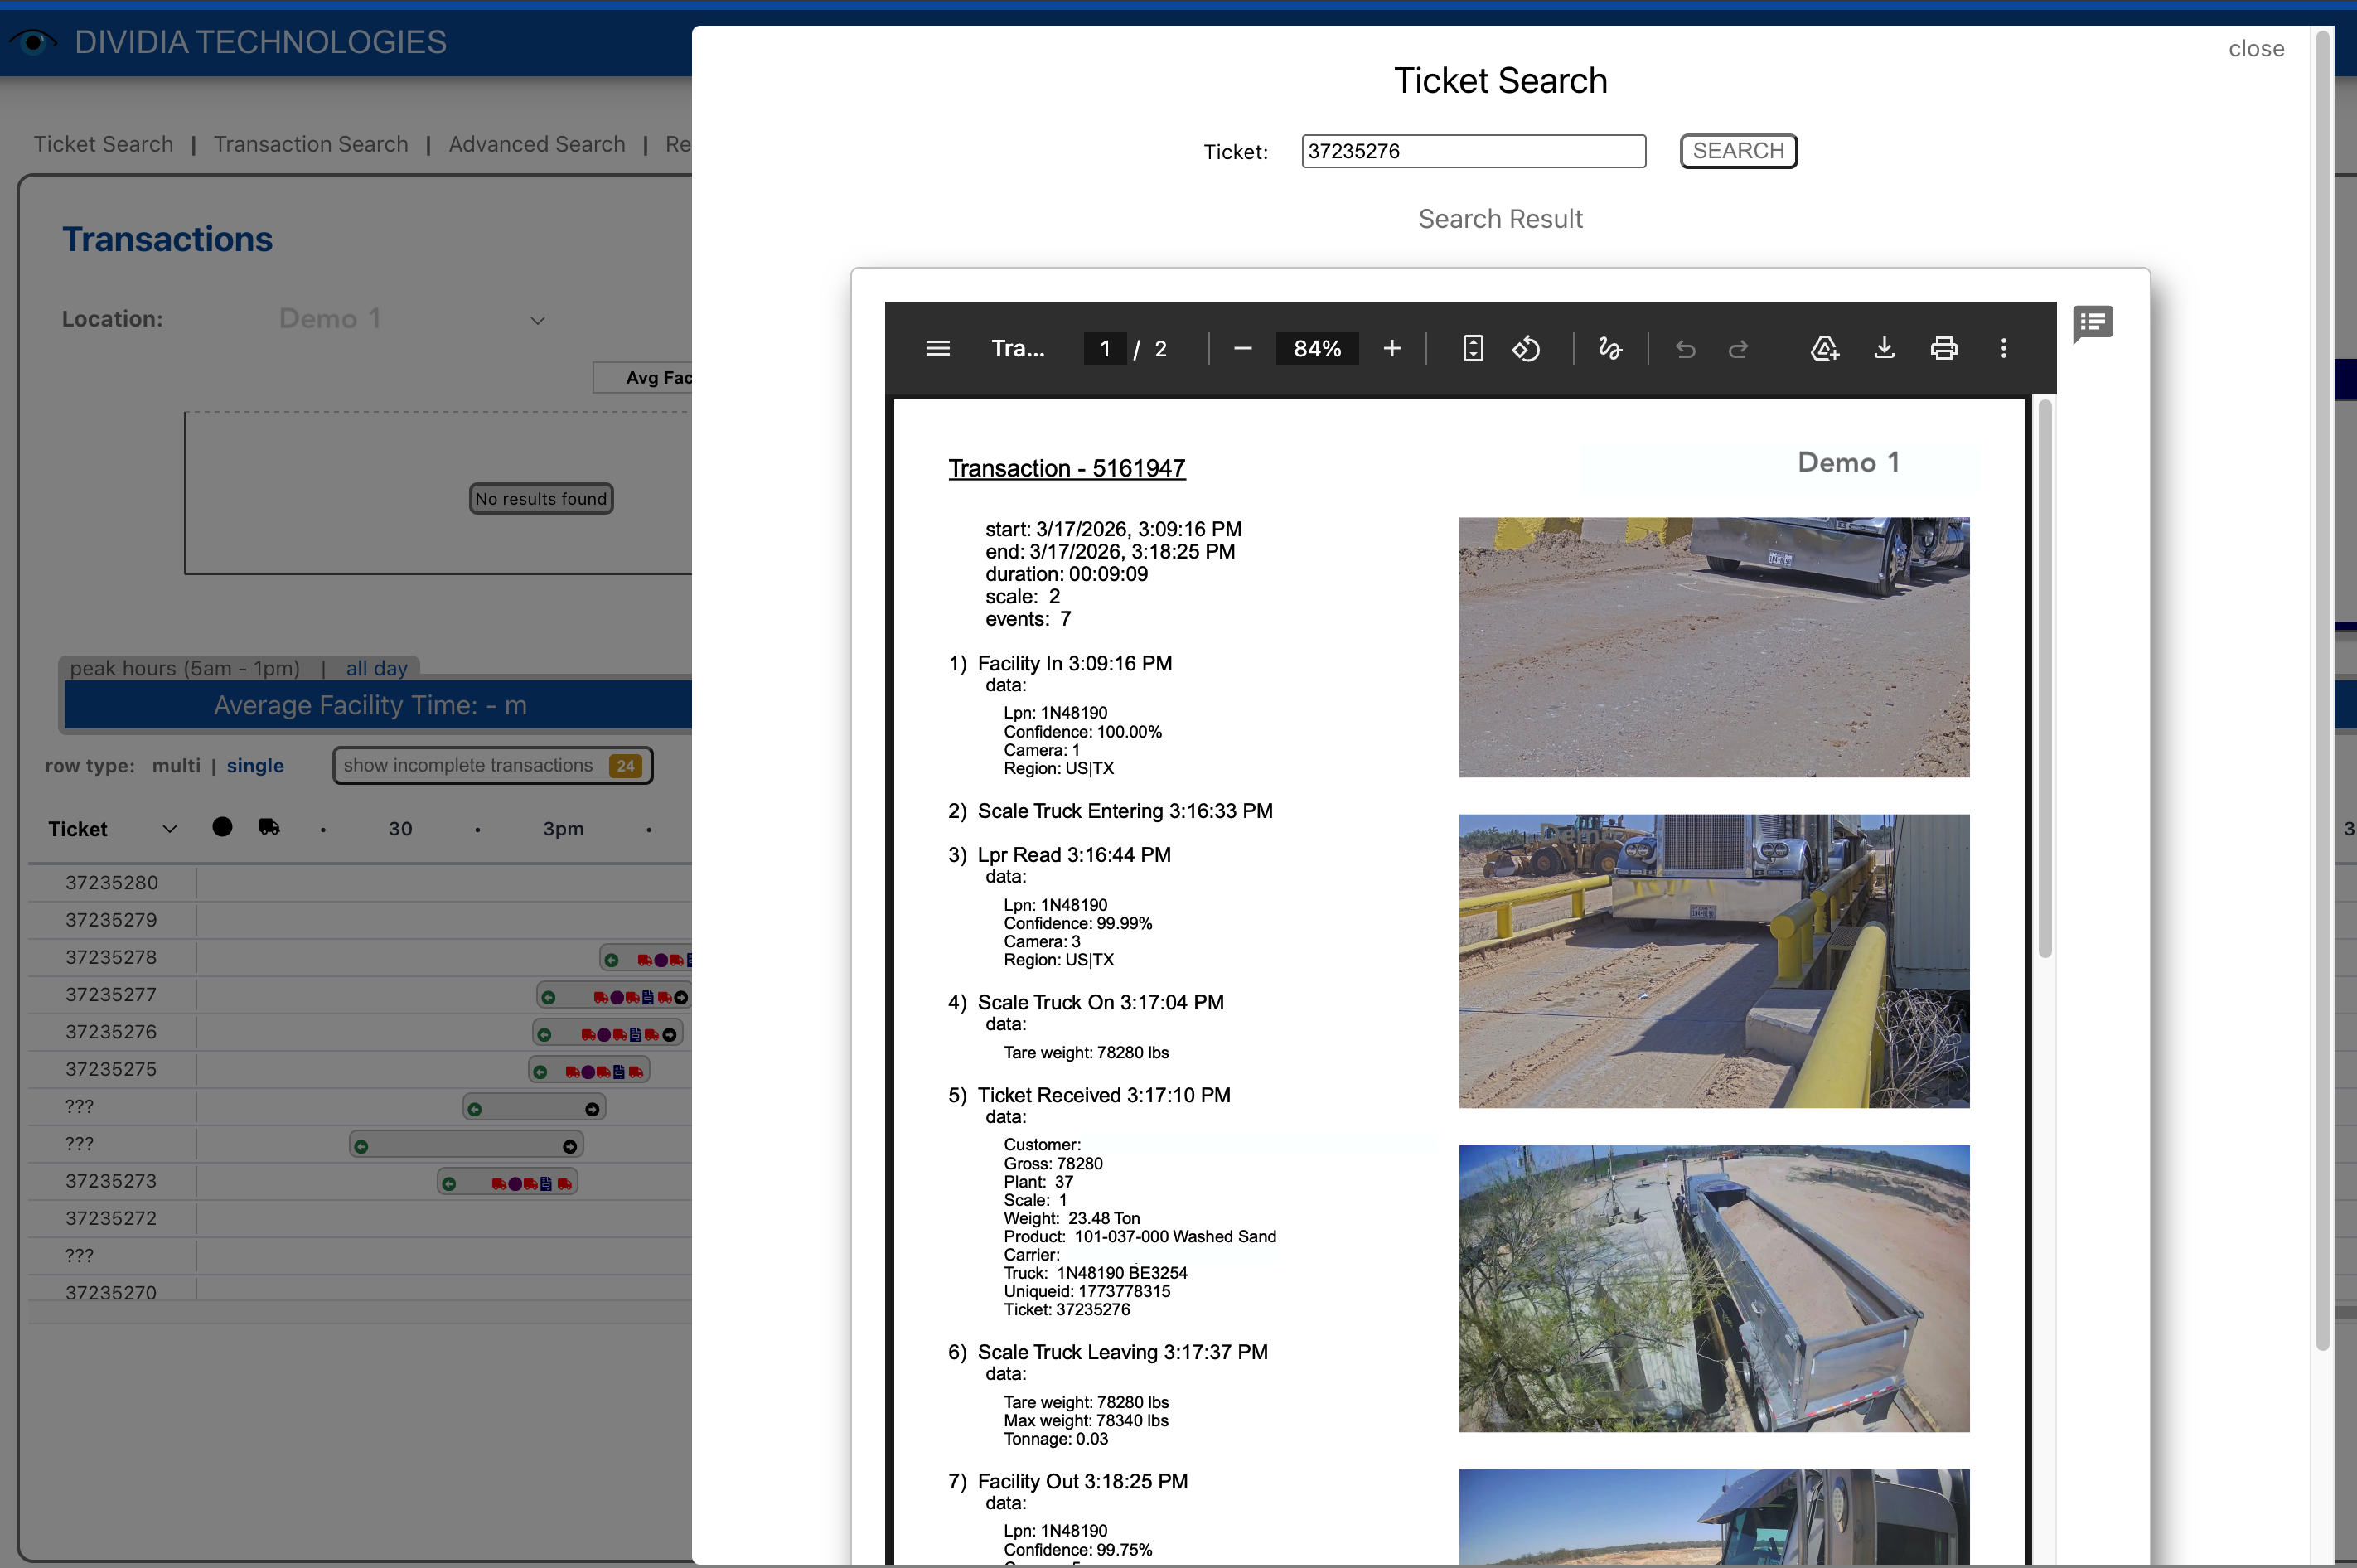
Ticket Search
Find a transaction by its ticket number.
Click Ticket Search in the header
Enter the ticket number
Click SEARCH
Ticket Search with results
The matching transaction opens in PDF view, showing all event details and images.
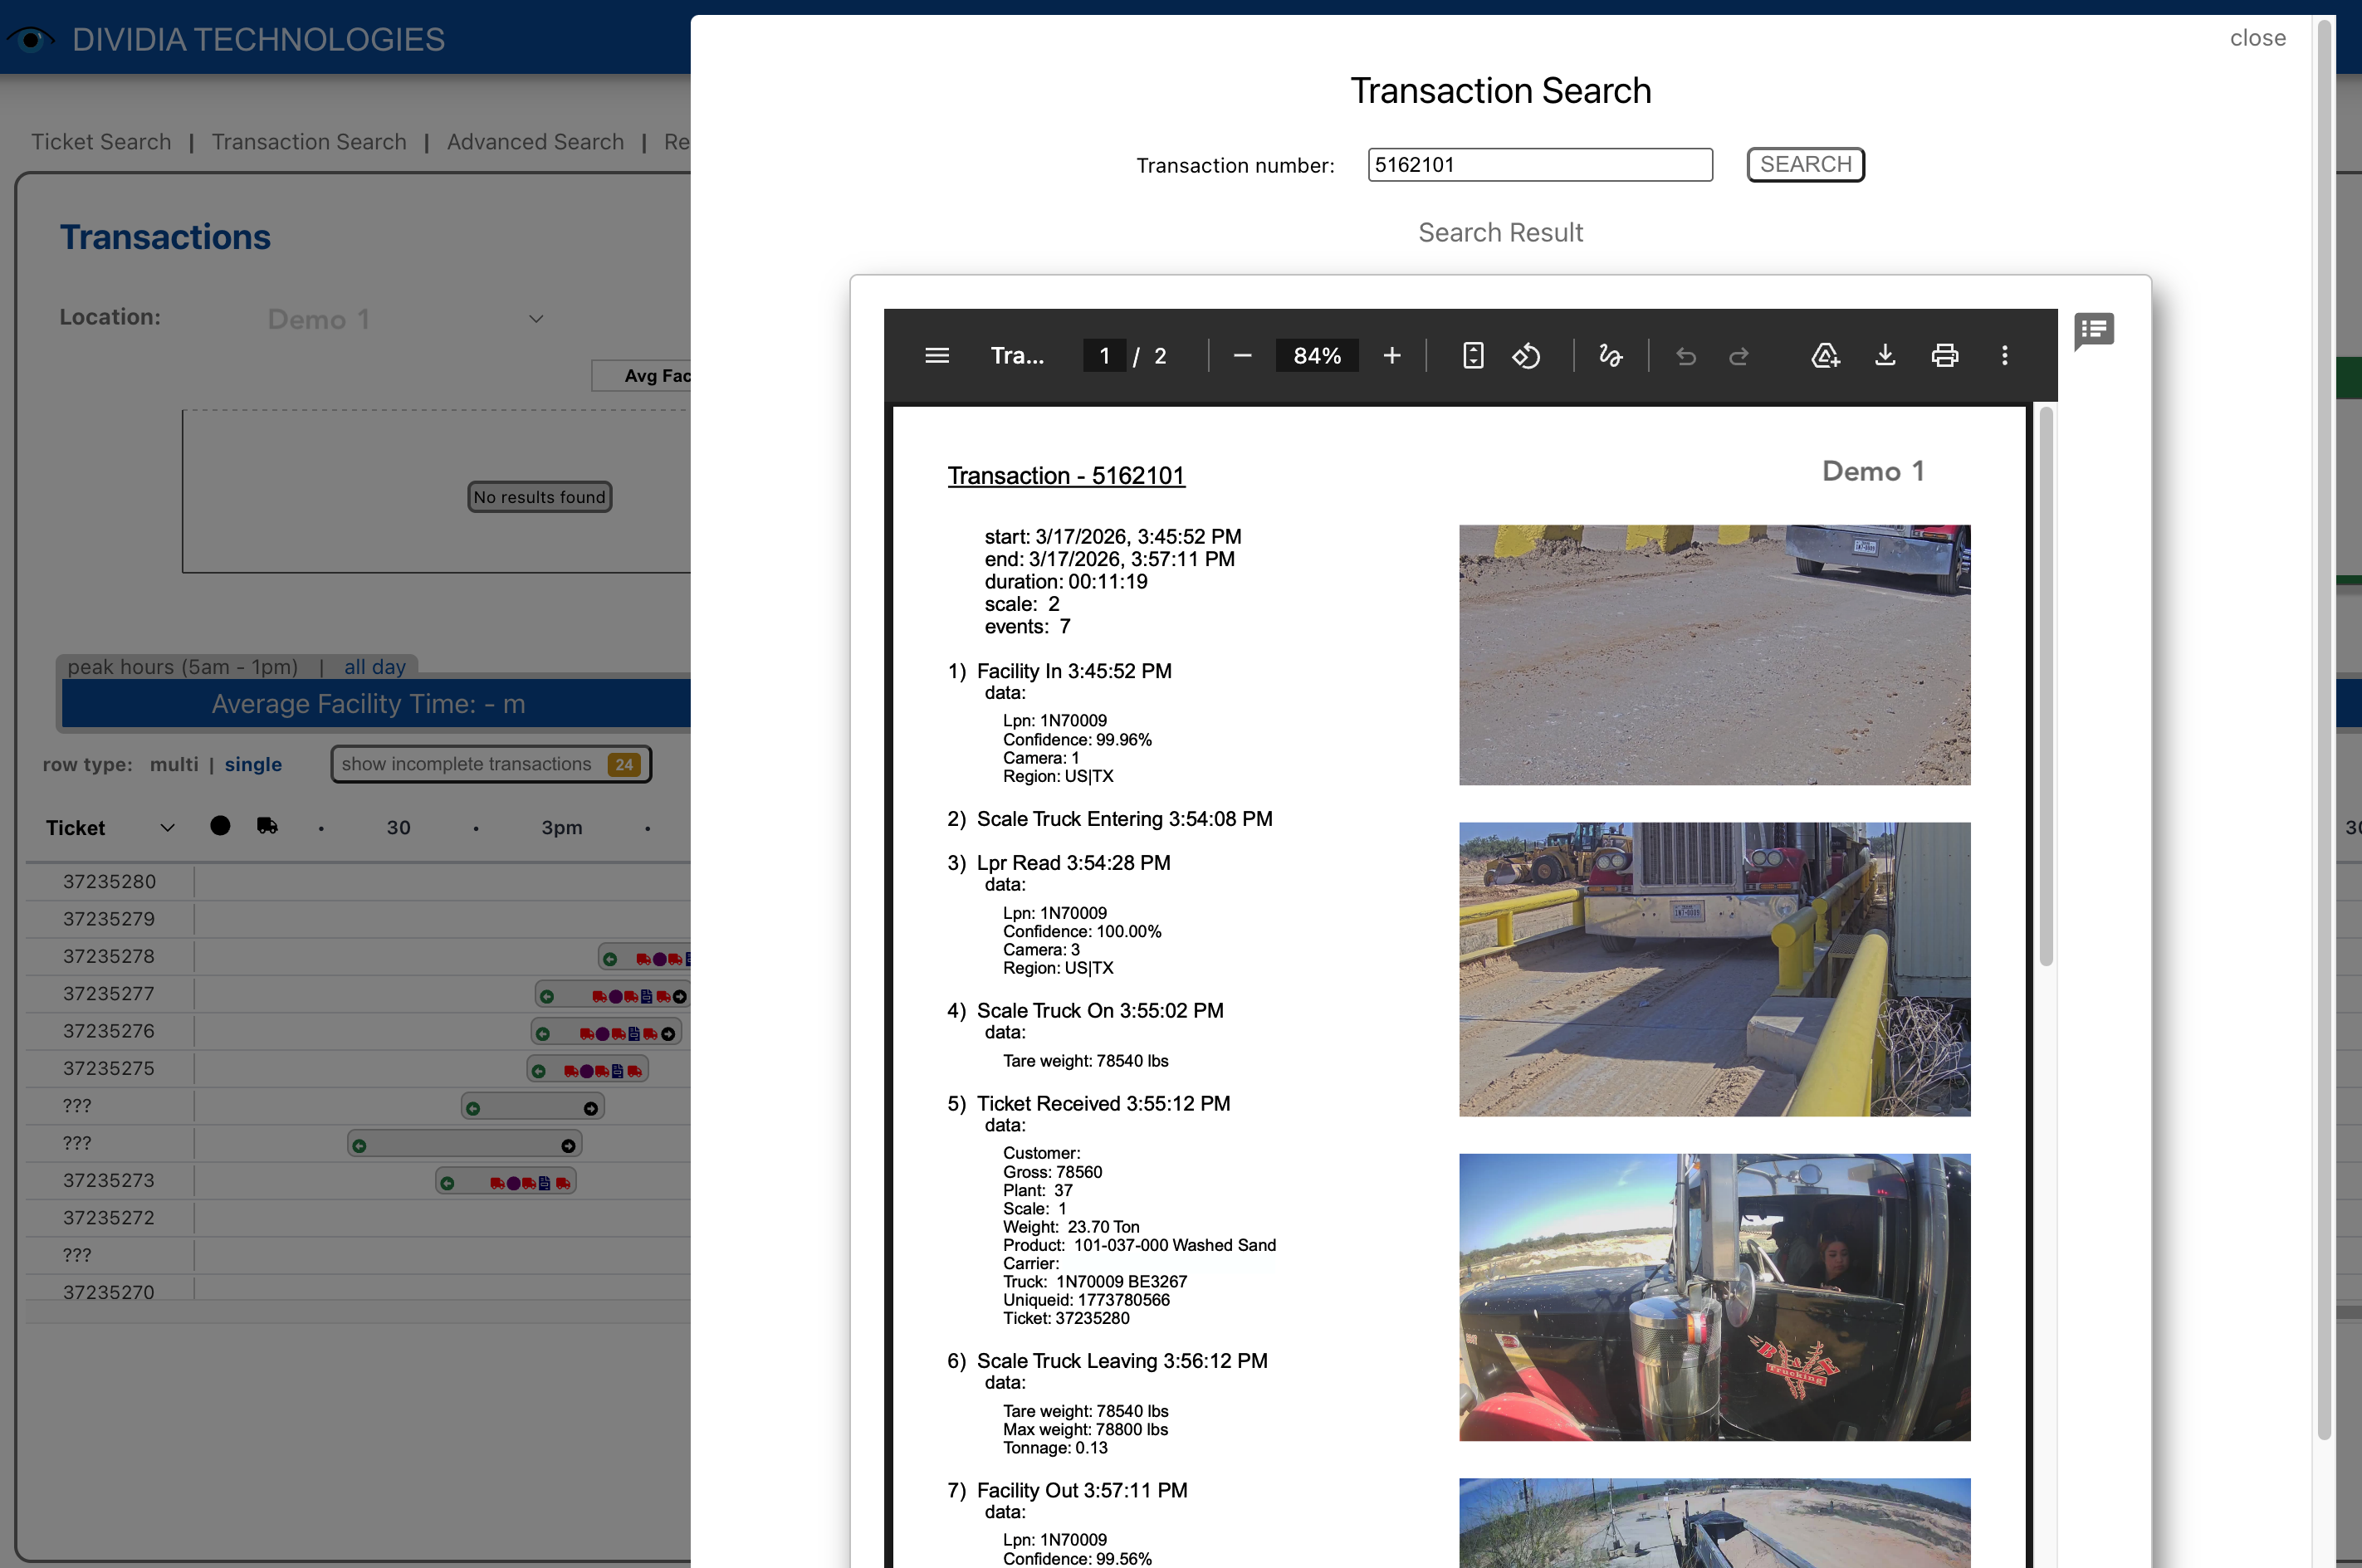
Transaction Search
Find a transaction by its internal transaction ID.
Click Transaction Search in the header
Enter the transaction number
Click SEARCH
Transaction Search with results
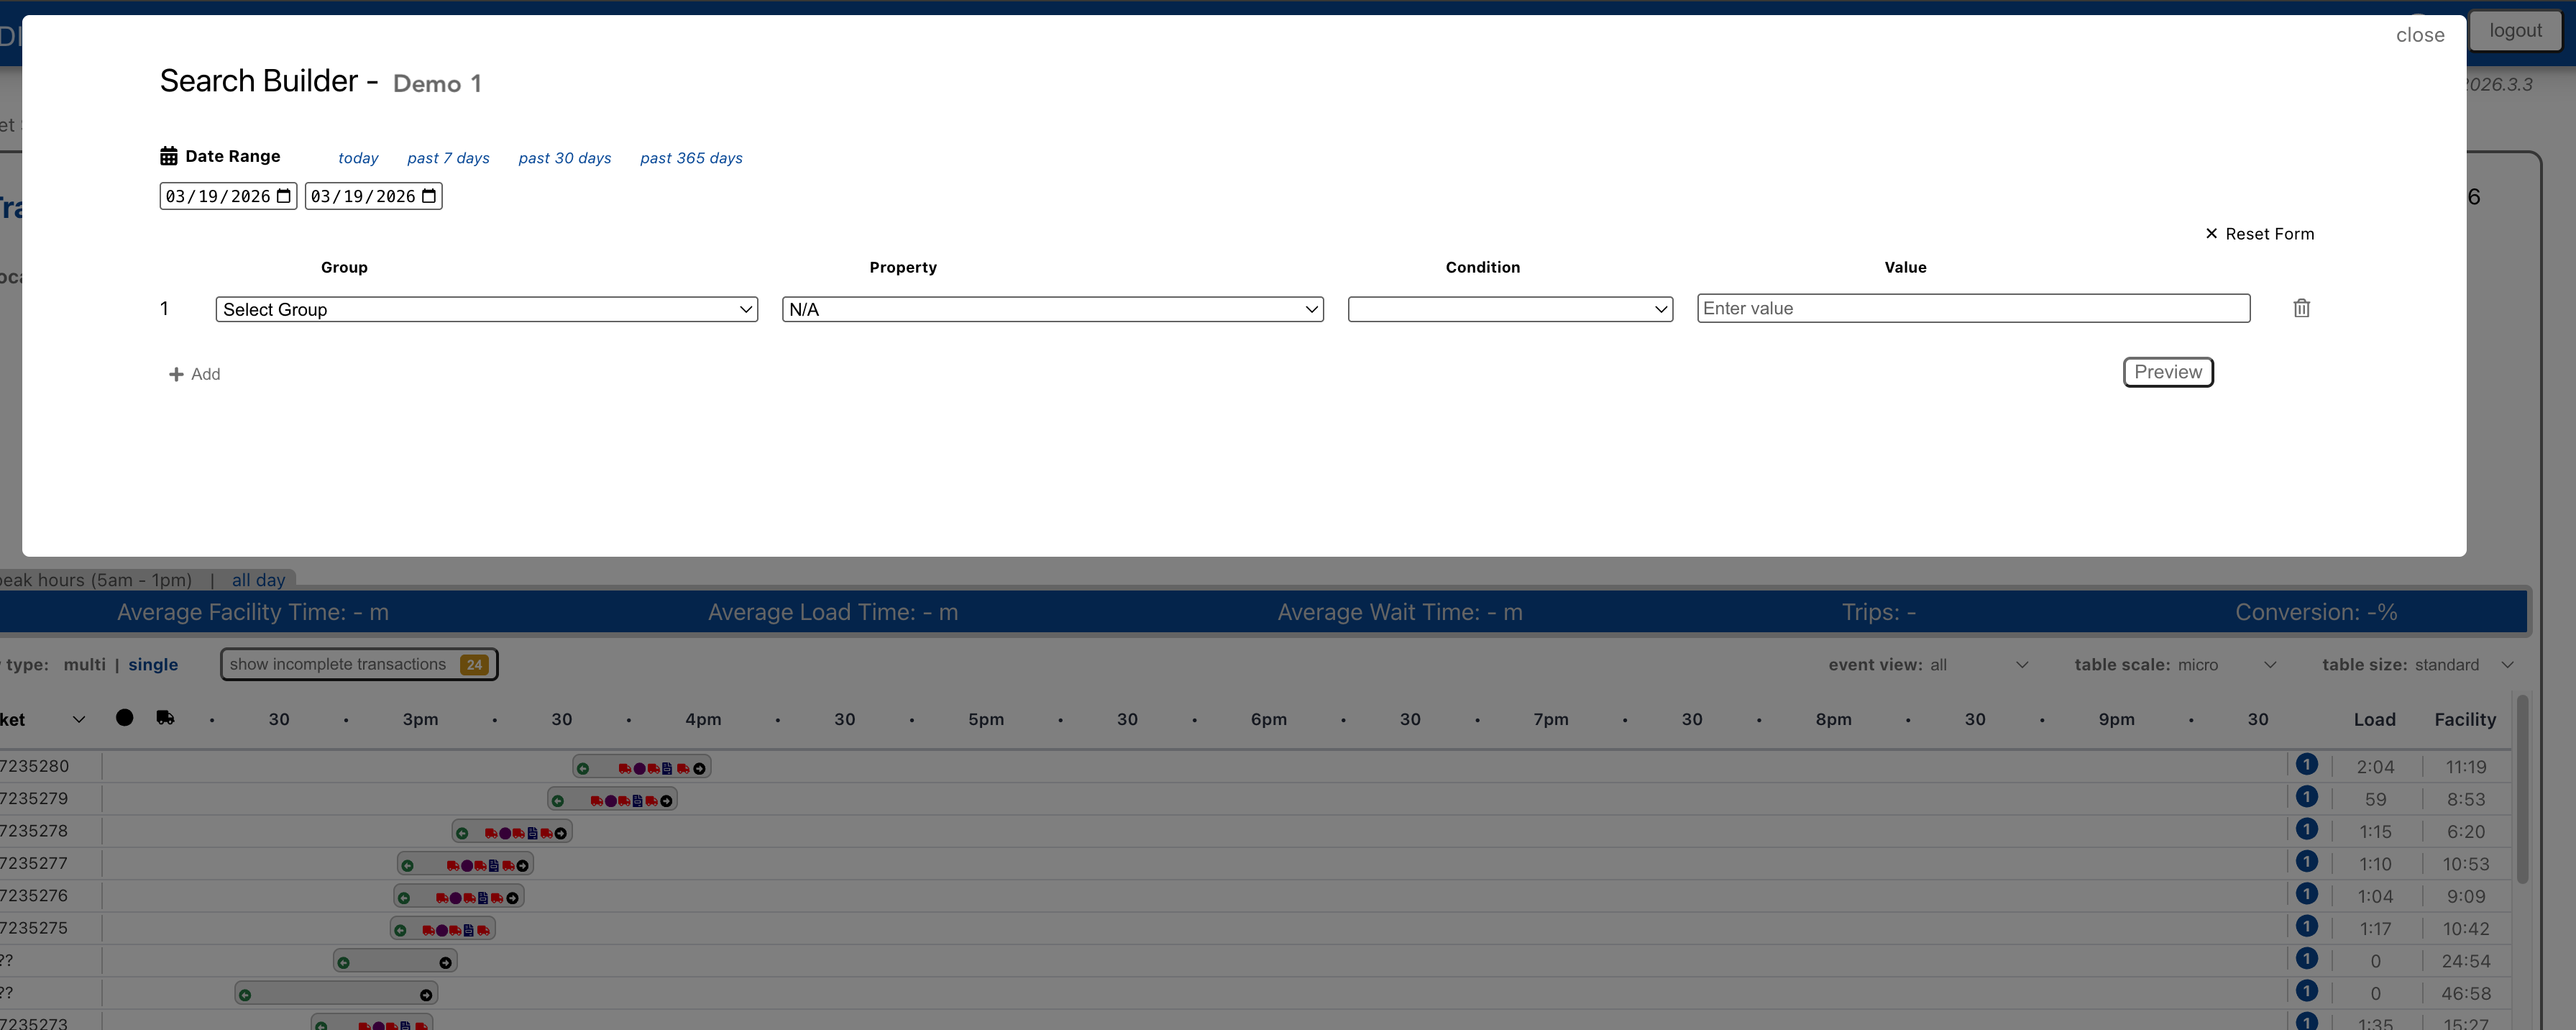
8.2 Advanced Search
For complex queries, use the Advanced Search builder.
Click Advanced Search in the header
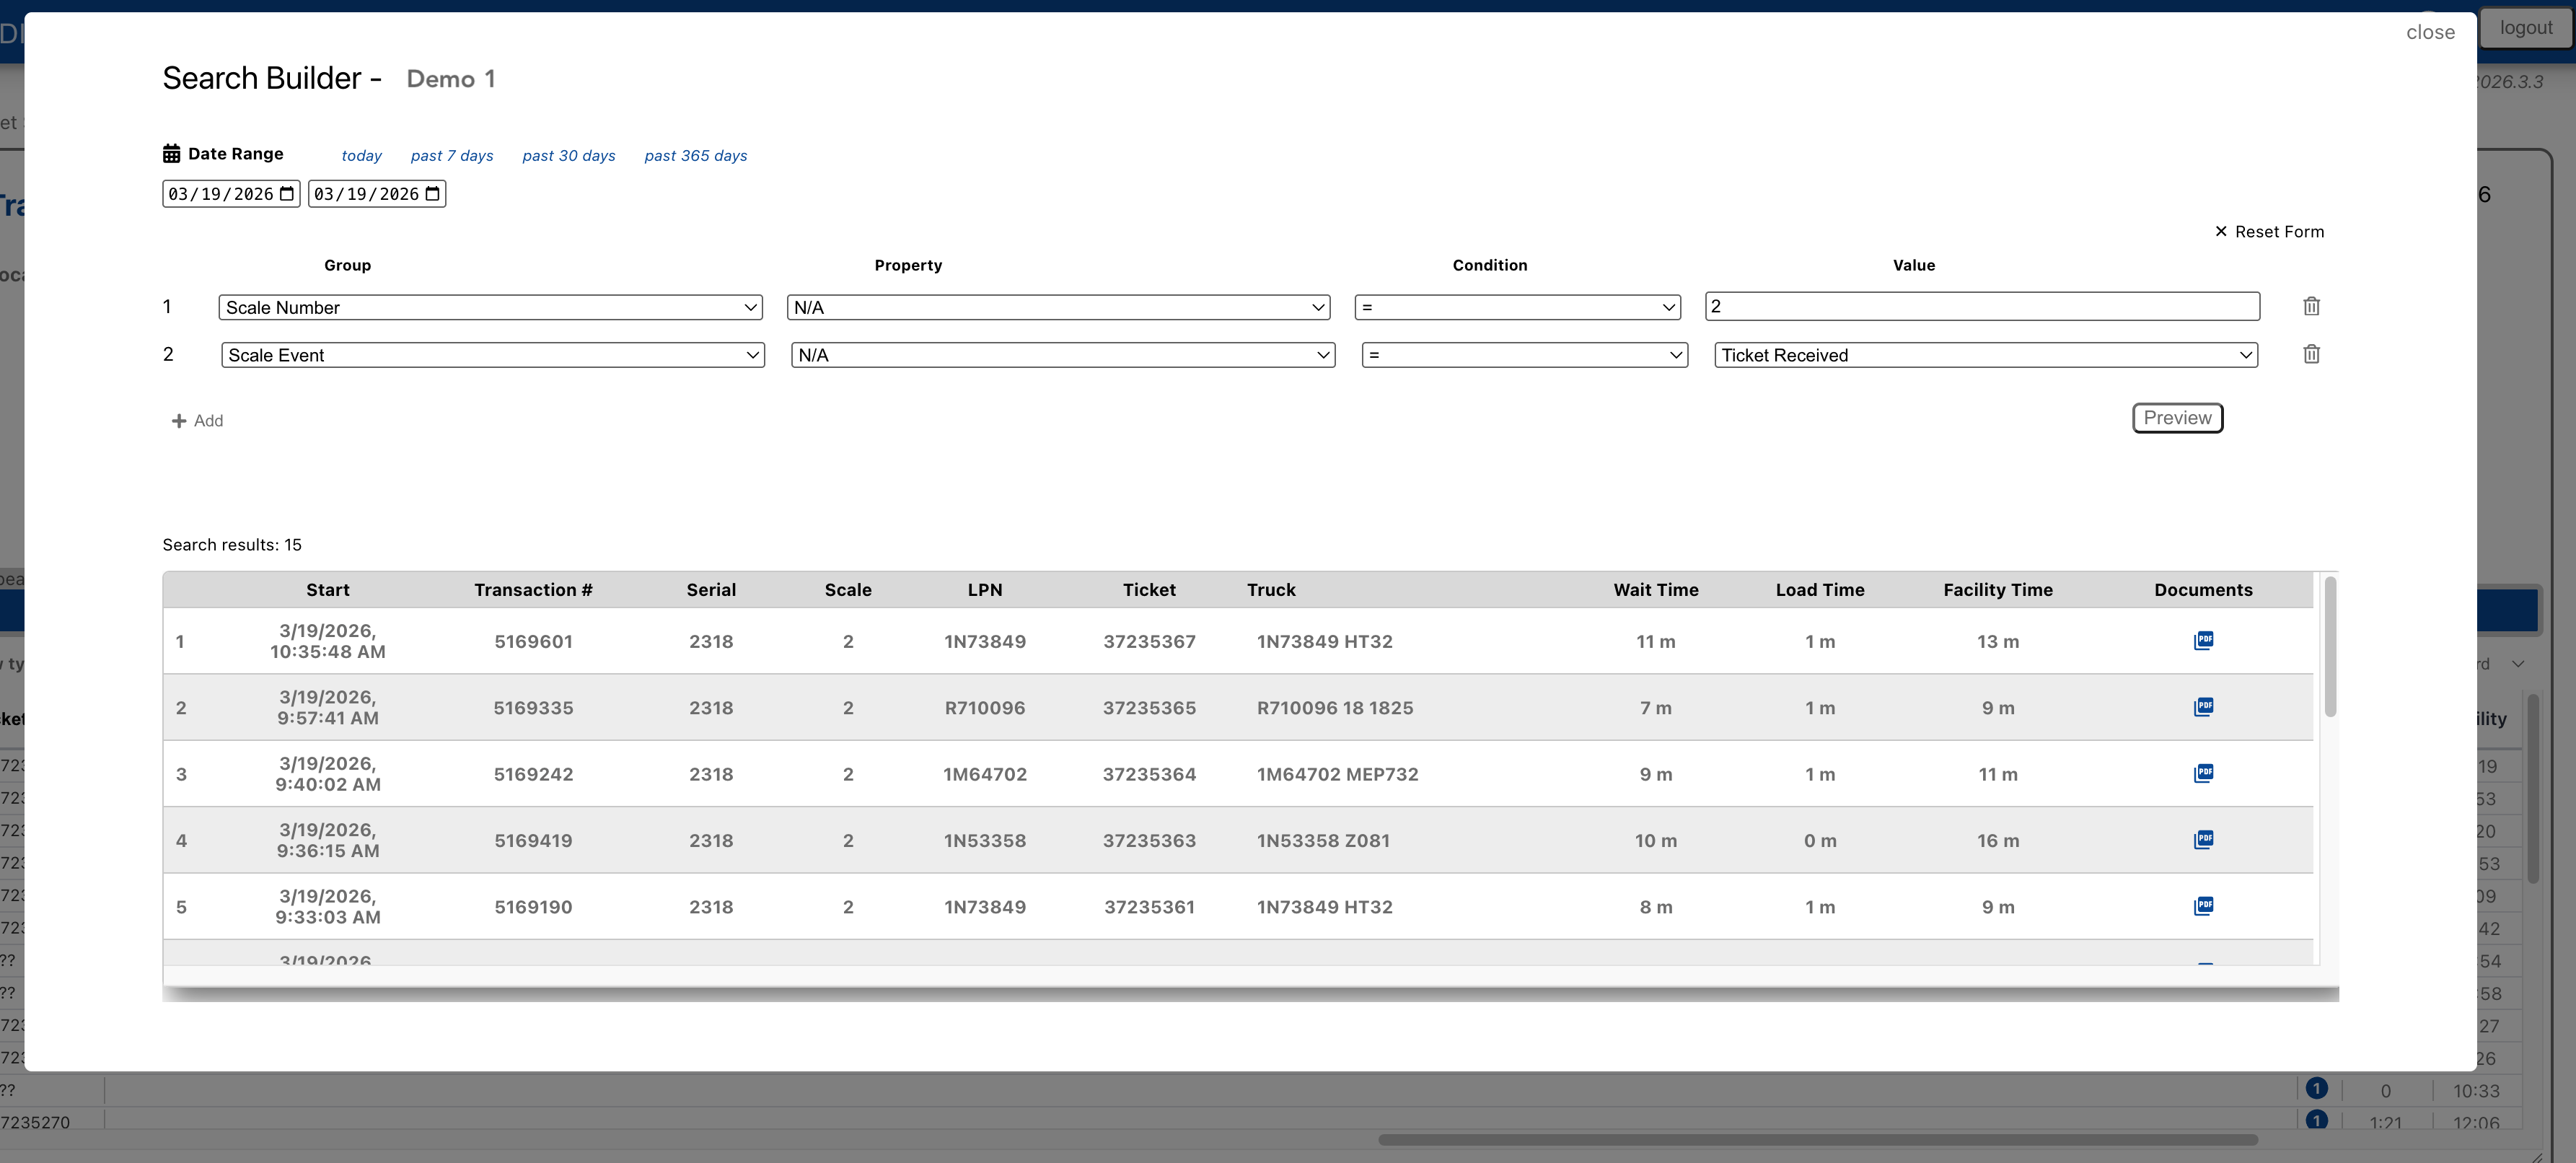
The Search Builder opens
Advanced Search Builder
Date Range
Select a preset range (today, past 7 days, past 30 days, past 365 days) or enter custom dates.
Note: Ticket Parameter fields are dynamically loaded based on your site's ticket data structure. Available fields may vary by facility.
8.3 Search Results
Search results with transaction list
Results display in a table showing:
Start time
Transaction ID
Serial/Site
Scale
LPN
Ticket
Truck
Wait Time
Load Time
Facility Time
Documents (click to view PDF)
Click any row to expand and see additional details. Click the document icon to view the transaction PDF.
9. Reports and Charting
ScaleWatcher Cloud includes built-in reports for analyzing your facility data. Access reports by clicking Reporting in the header.
Reporting screen with Facility Times chart
9.1 Report Navigation
Back Button Return to the Transaction View.
Site Selector Choose which site to report on.
Report List The left sidebar lists all available reports. Click a report name to select it. A blue dot indicates the currently active report.
9.2 Common Controls
Date Range Select the start and end dates for your report. Click Submit to generate the report.
Filter by Scale Some reports allow filtering to a specific scale.
Add Time Exclusion Exclude certain time ranges from calculations (useful for excluding lunch breaks or off-hours).
Export Options
Export to CSV: Download raw data for further analysis
Download Chart to PNG: Save the chart as an image for presentations
9.3 Available Reports
Time Analysis Reports
Min / Max / Avg Statistical analysis showing minimum, maximum, and average values for facility metrics.
Facility Times Line chart showing average time vehicles spend in the facility over the date range. Includes baseline average for comparison.
Load Times Duration of loading operations (time at the scale) over the date range.
Wait Times Idle time during transactions over the date range.
Facility By Product Facility times broken down by product/material type. Useful for identifying if certain products take longer to process.
Time By Carrier Processing times grouped by carrier. Compare efficiency across different transportation companies.
Volume Reports
Volume By Product Total volume (in tons) by product type. Horizontal bar chart showing product mix.
Transactions Per Day Bar chart showing daily transaction counts over the date range.
Transactions Per Hour Distribution of transactions by hour of day. Useful for identifying peak operating times.
Transactions Per Hour chart
Loads By Carrier Number of loads completed by each carrier.
Loads By Customer Number of loads grouped by customer account.
Query Reports
LPN Query Search for transactions by license plate number with detailed results.
Report By Scale Compare performance metrics across scales at your facility.
Report By Scale showing min/avg/max comparison
Truck Audit Comprehensive audit report showing all transactions for selected criteria with images.
Count Reports
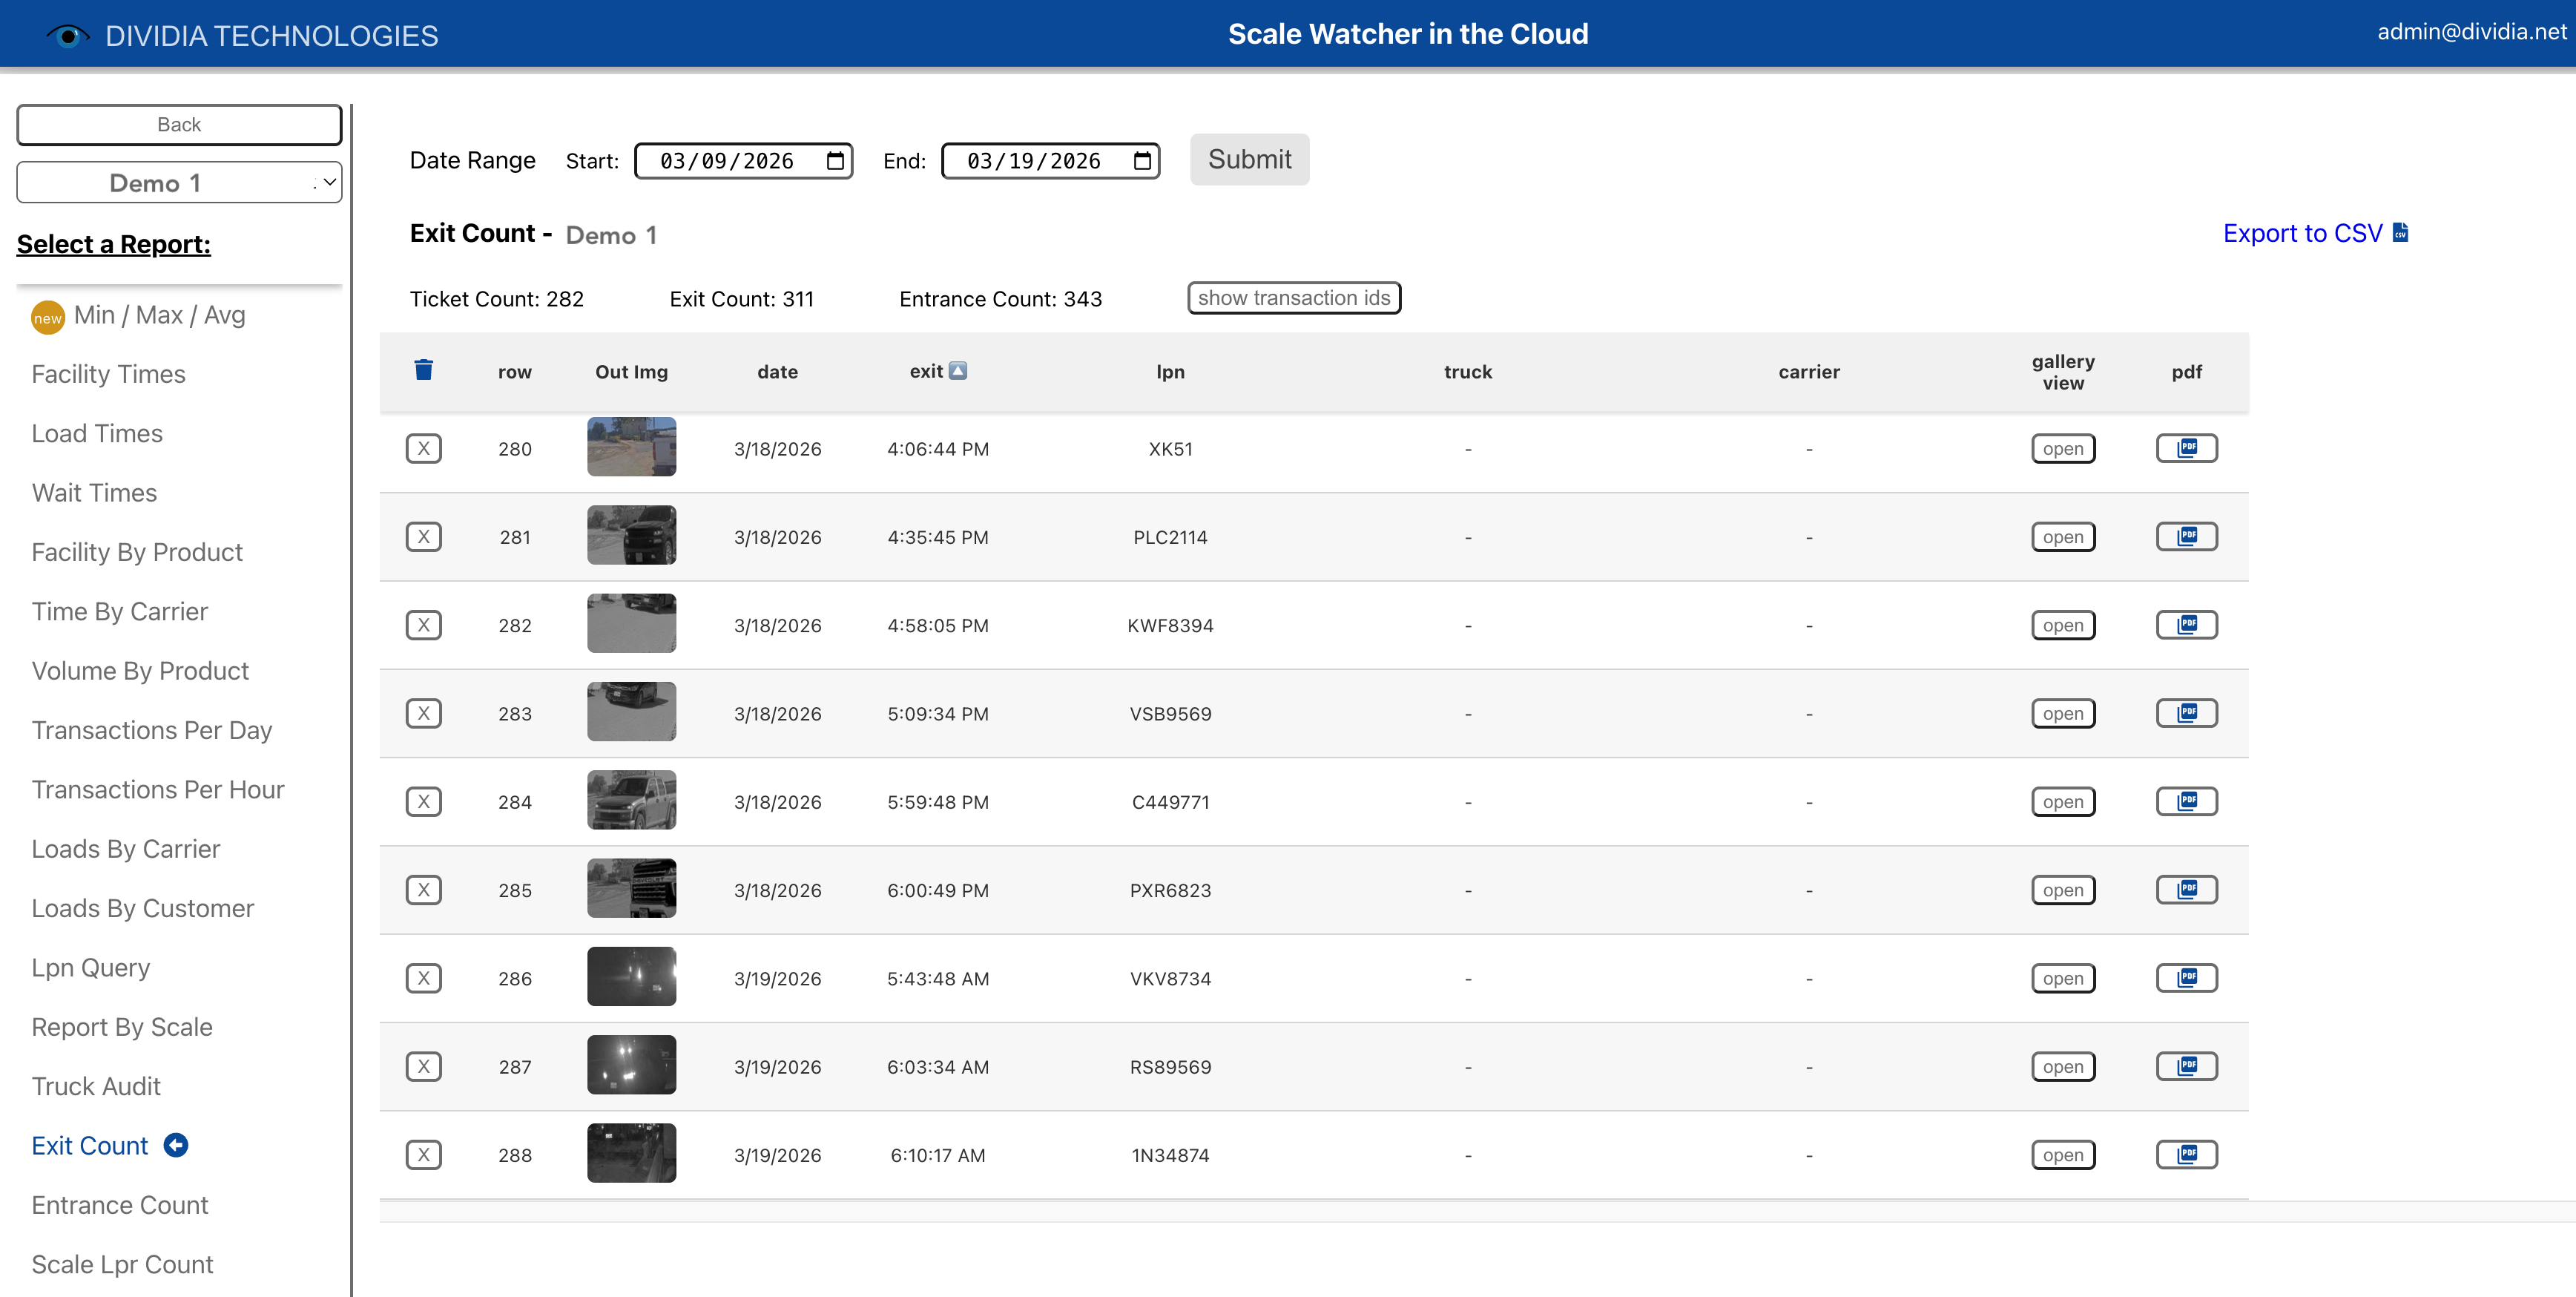
Exit Count Table of vehicles exiting the facility with timestamps and images.
Exit Count report
Entrance Count Table of vehicles entering the facility with timestamps and images.
Scale LPR Count Combined scale and license plate recognition counts.
AI Reports
AI Object Detection View AI-powered object detection results identifying vehicles, people, and license plates in transaction images.
Note: AI Object Detection is an optional feature that requires pre-configuration. For more information on enabling this capability, please contact your Dividia Technologies sales representative.
10. Customer Disputes and Accountability
One of ScaleWatcher Cloud's primary functions is providing documentation for accountability and dispute resolution.
10.1 Why Documentation Matters
Questions and disputes about transactions are common in logistics operations:
"Was my truck actually weighed?"
"What time did the vehicle arrive and leave?"
"Is this the correct weight for my load?"
"Was the product actually loaded?"
ScaleWatcher Cloud provides timestamped, image-verified records that answer these questions definitively.
10.2 Using Transaction PDFs
The Transaction PDF is your primary tool for documentation. It contains:
Transaction summary: Start time, end time, duration, scale used
Complete event list: Every event with timestamp and data
Images: Photos from each camera at each event
Ticket data: Customer, product, weight, carrier, ticket number
To generate a PDF:
Find the transaction using Search or the Transaction View
Click on the 'PDF' button or Open the Gallery View
Click transaction pdf
Use the toolbar to print or download
The PDF can be:
Emailed to customers or carriers
Printed for physical records
Saved for audit purposes
Used in dispute resolution
10.3 Searching Historical Data
Quick Lookup If you have a ticket number, use Ticket Search for immediate results.
Date-Based Search Use the Transaction View date picker to navigate to a specific day, then locate the ticket / transaction on the timeline.
Complex Queries Use Advanced Search to find transactions by:
LPN (license plate)
Customer name
Carrier
Weight range
Time range
Scale number
10.4 Best Practices
Respond promptly: Use the search tools to quickly locate transactions when questions arise
Share documentation: Send PDFs via email for clear communication
Save important records: Download PDFs of transactions that may be referenced later
Review alerts: Address No Ticket and Weight Mismatch alerts to catch issues early
11. Administration
Users with admin permissions can manage users etc. through the Admin Screen.
11.1 Accessing Admin Screen
Click your user email in the upper right of the header
Click Admin Screen
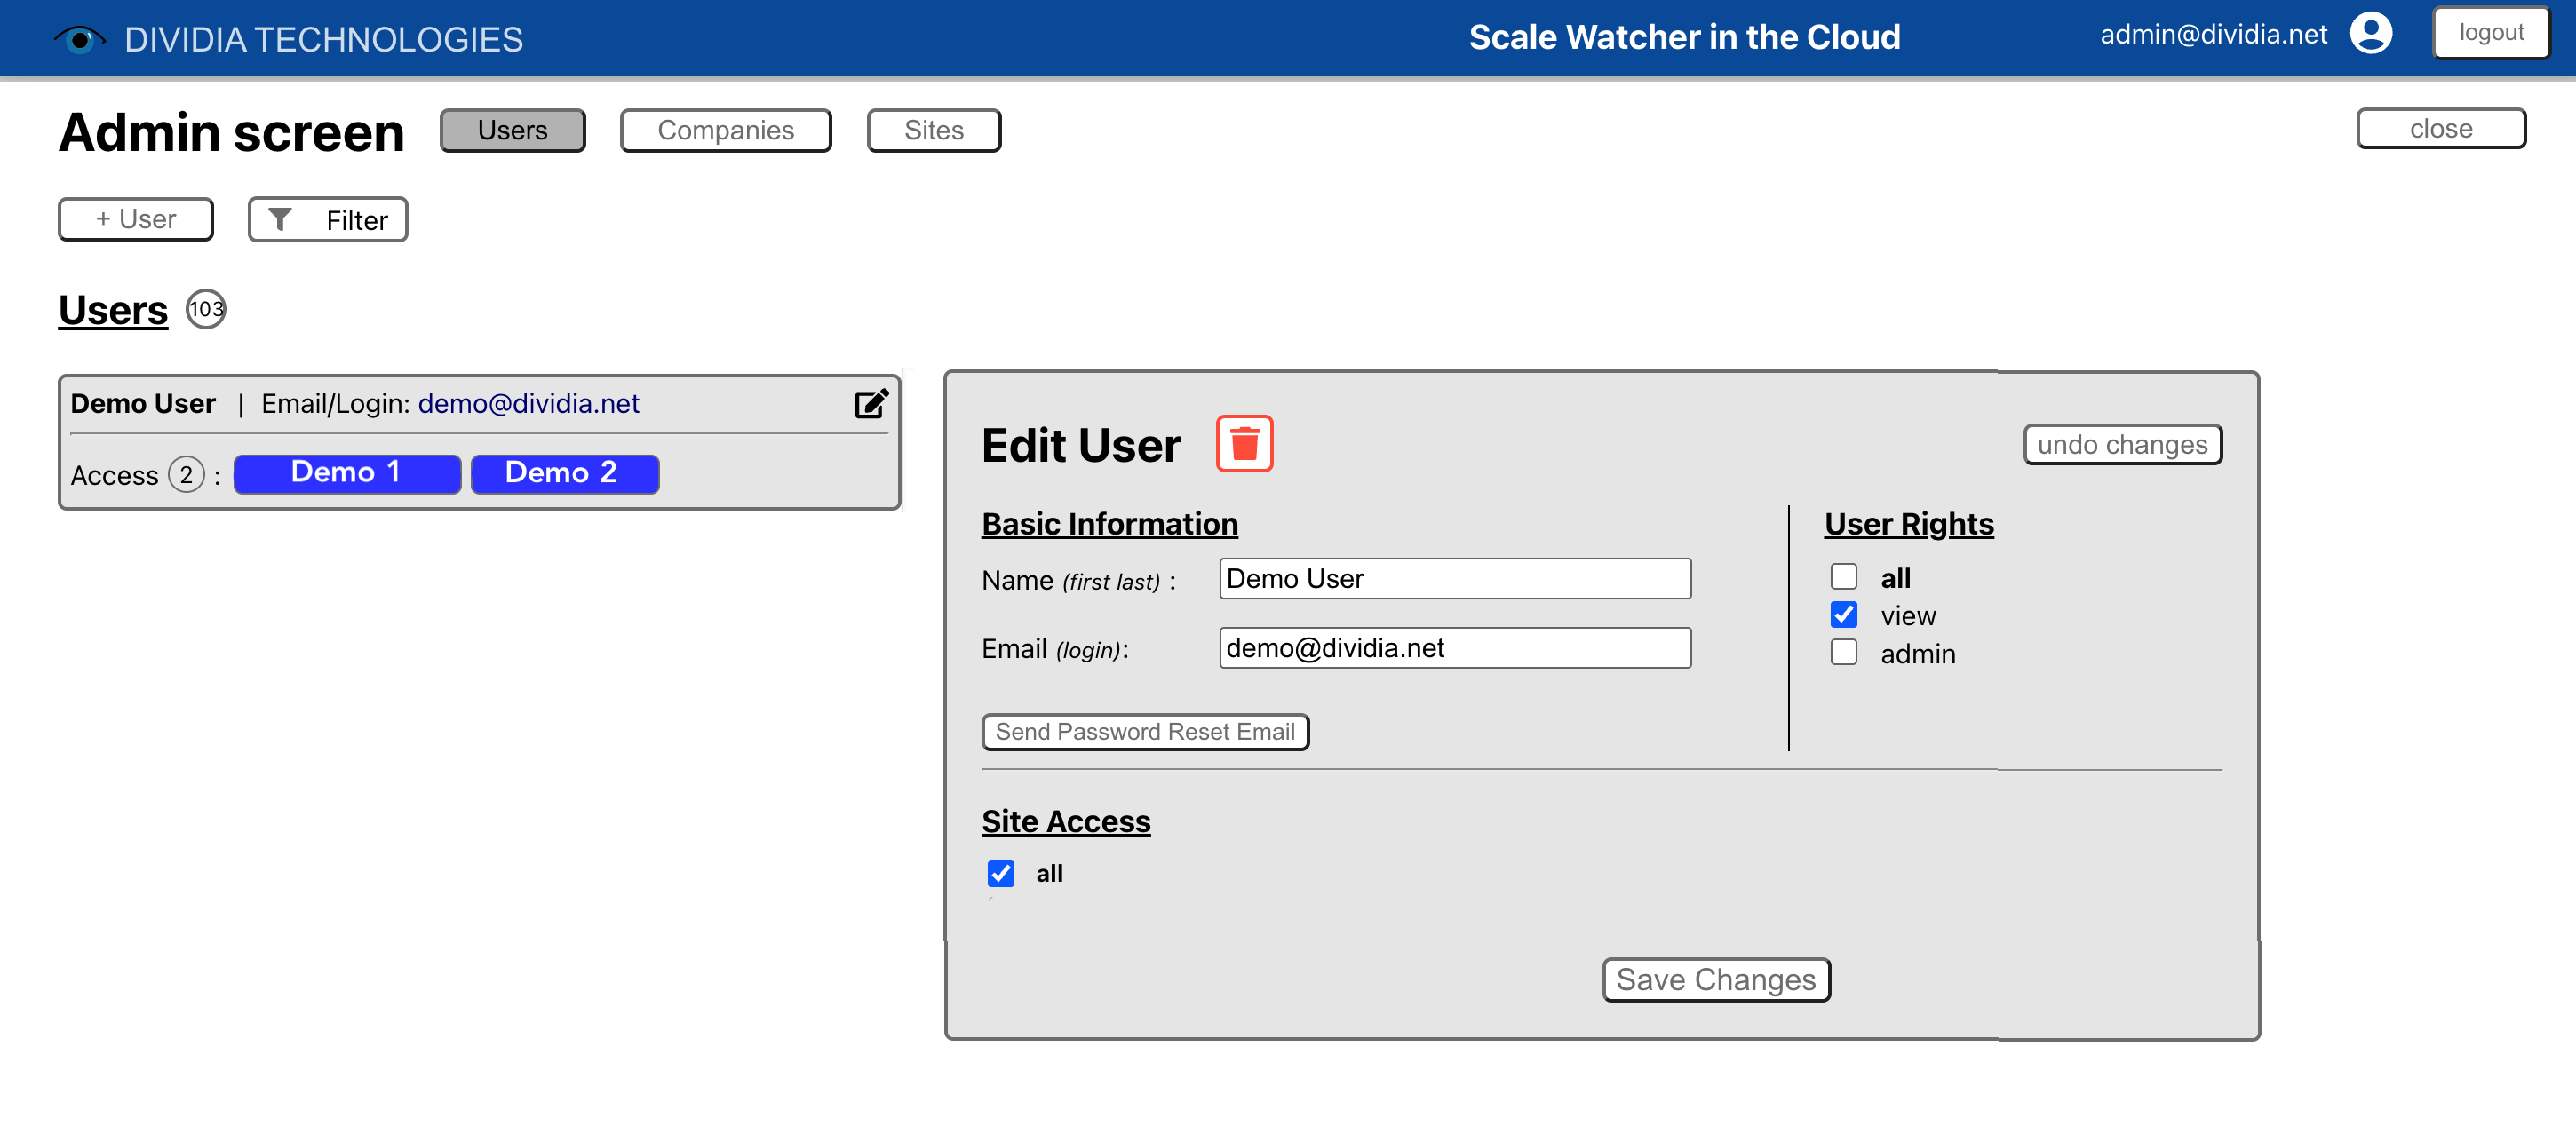
Admin Screen - Users tab
11.2 User Management
The Users tab displays all users in your organization.
Viewing Users The left panel lists all users with their email and site access count. Site access is shown as colored badges.
Creating a New User
Click + User
Fill in the user form:
Name: User's full name
Email: Login email address (must be unique)
Set User Rights:
view: Basic access to see data (always enabled)
admin: Full administrative access
all: Enable all permissions
Assign Site Access:
Check the sites this user should access
Users must have access to at least one site
Click Save Changes
Editing a User Click the edit icon next to a user to load their details in the form. Make changes and click Save Changes.
Password Reset Click Send Password Reset Email to send the user a link to reset their password.
Deleting a User Click the delete icon (trash can) in the form to remove a user. You cannot delete your own account.
11.3 User Permissions
View Base access level. Users can see transaction data, alerts, and reports for their assigned sites.
Admin Full administrative access including:
Managing users
Configuring alerts
Accessing all features
Viewing data across all assigned sites
11.4 Site Access
Users only see data for sites they have been granted access to. When assigning site access:
Check individual sites, or
Check all to grant access to all sites
Site access determines:
Which locations appear in the Location dropdown
Which transactions and alerts are visible
Which sites appear in reports
11.5 Filtering Admin Lists
Click the Filter button to search within the admin lists:
User Filters: Name, email, site access
12. Implementation Requirements
12.1 For End Users
Web Browser Chrome, Firefox, Safari, or Edge (current version recommended)
JavaScript Must be enabled in browser settings
Network Access Must be able to reach: https://scalewatcher.cloud.dividia.net
12.2 For On-Premise NVR
Outbound Network Access The NVR must have outbound HTTPS access to: https://api.cloud.dividia.net
Firewall Configuration Port 443 (HTTPS) must be open for outbound connections from the NVR's IP address
Stable Internet A reliable internet connection is required for transaction uploads
12.3 Data Flow Summary
Cameras capture images at facility entrance, exit, and scale positions
NVR processes video, performs license plate recognition, and compiles events into transactions
NVR uploads completed transactions to the cloud backend
Cloud stores data and makes it available via the web application
Users access data through their web browser from any location
13. Appendix
Appendix A: Event Types Reference
Event Type
Icon
Description
Facility In
Green circle/arrow
Vehicle detected entering the facility
Facility Out
Black circle/arrow
Vehicle detected exiting the facility
Scale Truck Entering
Red truck
Scale weight beginning to increase (vehicle pulling on)
Scale Truck On
Red truck
Vehicle fully on scale, weight stable
Scale Truck Leaving
Red truck
Scale weight decreasing (vehicle pulling off)
LPR Read
Purple circle
License plate recognized by camera
Ticket Received
Navy document
Ticket data received from ticketing system
Valve Opened
Green star
Loading valve opened
Valve Closed
Blue star
Loading valve closed
Alert
Gold triangle
Anomaly detected for this event
Appendix B: Alert Types Reference
Alert Type
Trigger Condition
Recommended Action
No Ticket
Vehicle loaded without ticket
Review transaction, verify with operator
Overweight
Weight exceeds threshold
Check load, verify vehicle limits
Weight Mismatch
Ticket ≠ scale reading
Compare ticket and scale data, investigate
Tare Contamination
High tare weight
Inspect vehicle for pre-loaded material
Valve Alert
Valve closed without ticket
Verify loading completed properly
Manual Ticket
Manually entered ticket
Confirm manual entry was authorized
Scale Connection
Scale comm lost/restored
Check scale connectivity
Waste Ticket
Waste ticket generated
Standard for waste handling operations
Scale Data Fail
Missing scale data
Check scale integration
Valve Data Fail
Missing valve data
Check valve controller integration
Appendix C: Report Availability
Report
Description
Chart Type
Min / Max / Avg
Statistical analysis
Line
Facility Times
Time in facility trend
Line
Load Times
Loading duration trend
Line
Wait Times
Wait duration trend
Line
Facility By Product
Times by material
Multi-line
Time By Carrier
Times by carrier
Multi-line
Volume By Product
Tonnage by product
Horizontal bar
Transactions Per Day
Daily counts
Bar
Transactions Per Hour
Hourly distribution
Bar
Loads By Carrier
Loads by carrier
Horizontal bar
Loads By Customer
Loads by customer
Horizontal bar
LPN Query
LPN search
Table
Report By Scale
Scale comparison
Bar
Truck Audit
Transaction audit
Table
Exit Count
Exit transactions
Table
Entrance Count
Entry transactions
Table
Scale LPR Count
Scale + LPR counts
Table
AI Object Detection
AI detection results
Table
Appendix D: Glossary
Conversion Rate Percentage of LPR reads that result in completed transactions with tickets.
Event A single action captured during a transaction (Facility In, Scale Truck On, etc.).
Facility Time Total time from vehicle entry (Facility In) to exit (Facility Out).
Load Time Time spent at the scale during loading (Scale Truck Entering to Scale Truck Leaving).
LPN License Plate Number - used to identify and track vehicles.
LPR License Plate Recognition - automated detection of license plates from camera images.
NVR Network Video Recorder - the on-premise server that captures video and processes transactions.
Transaction A complete record of a vehicle's journey through the facility, containing multiple events.
Wait Time Idle time during a transaction (time in facility minus active load time).
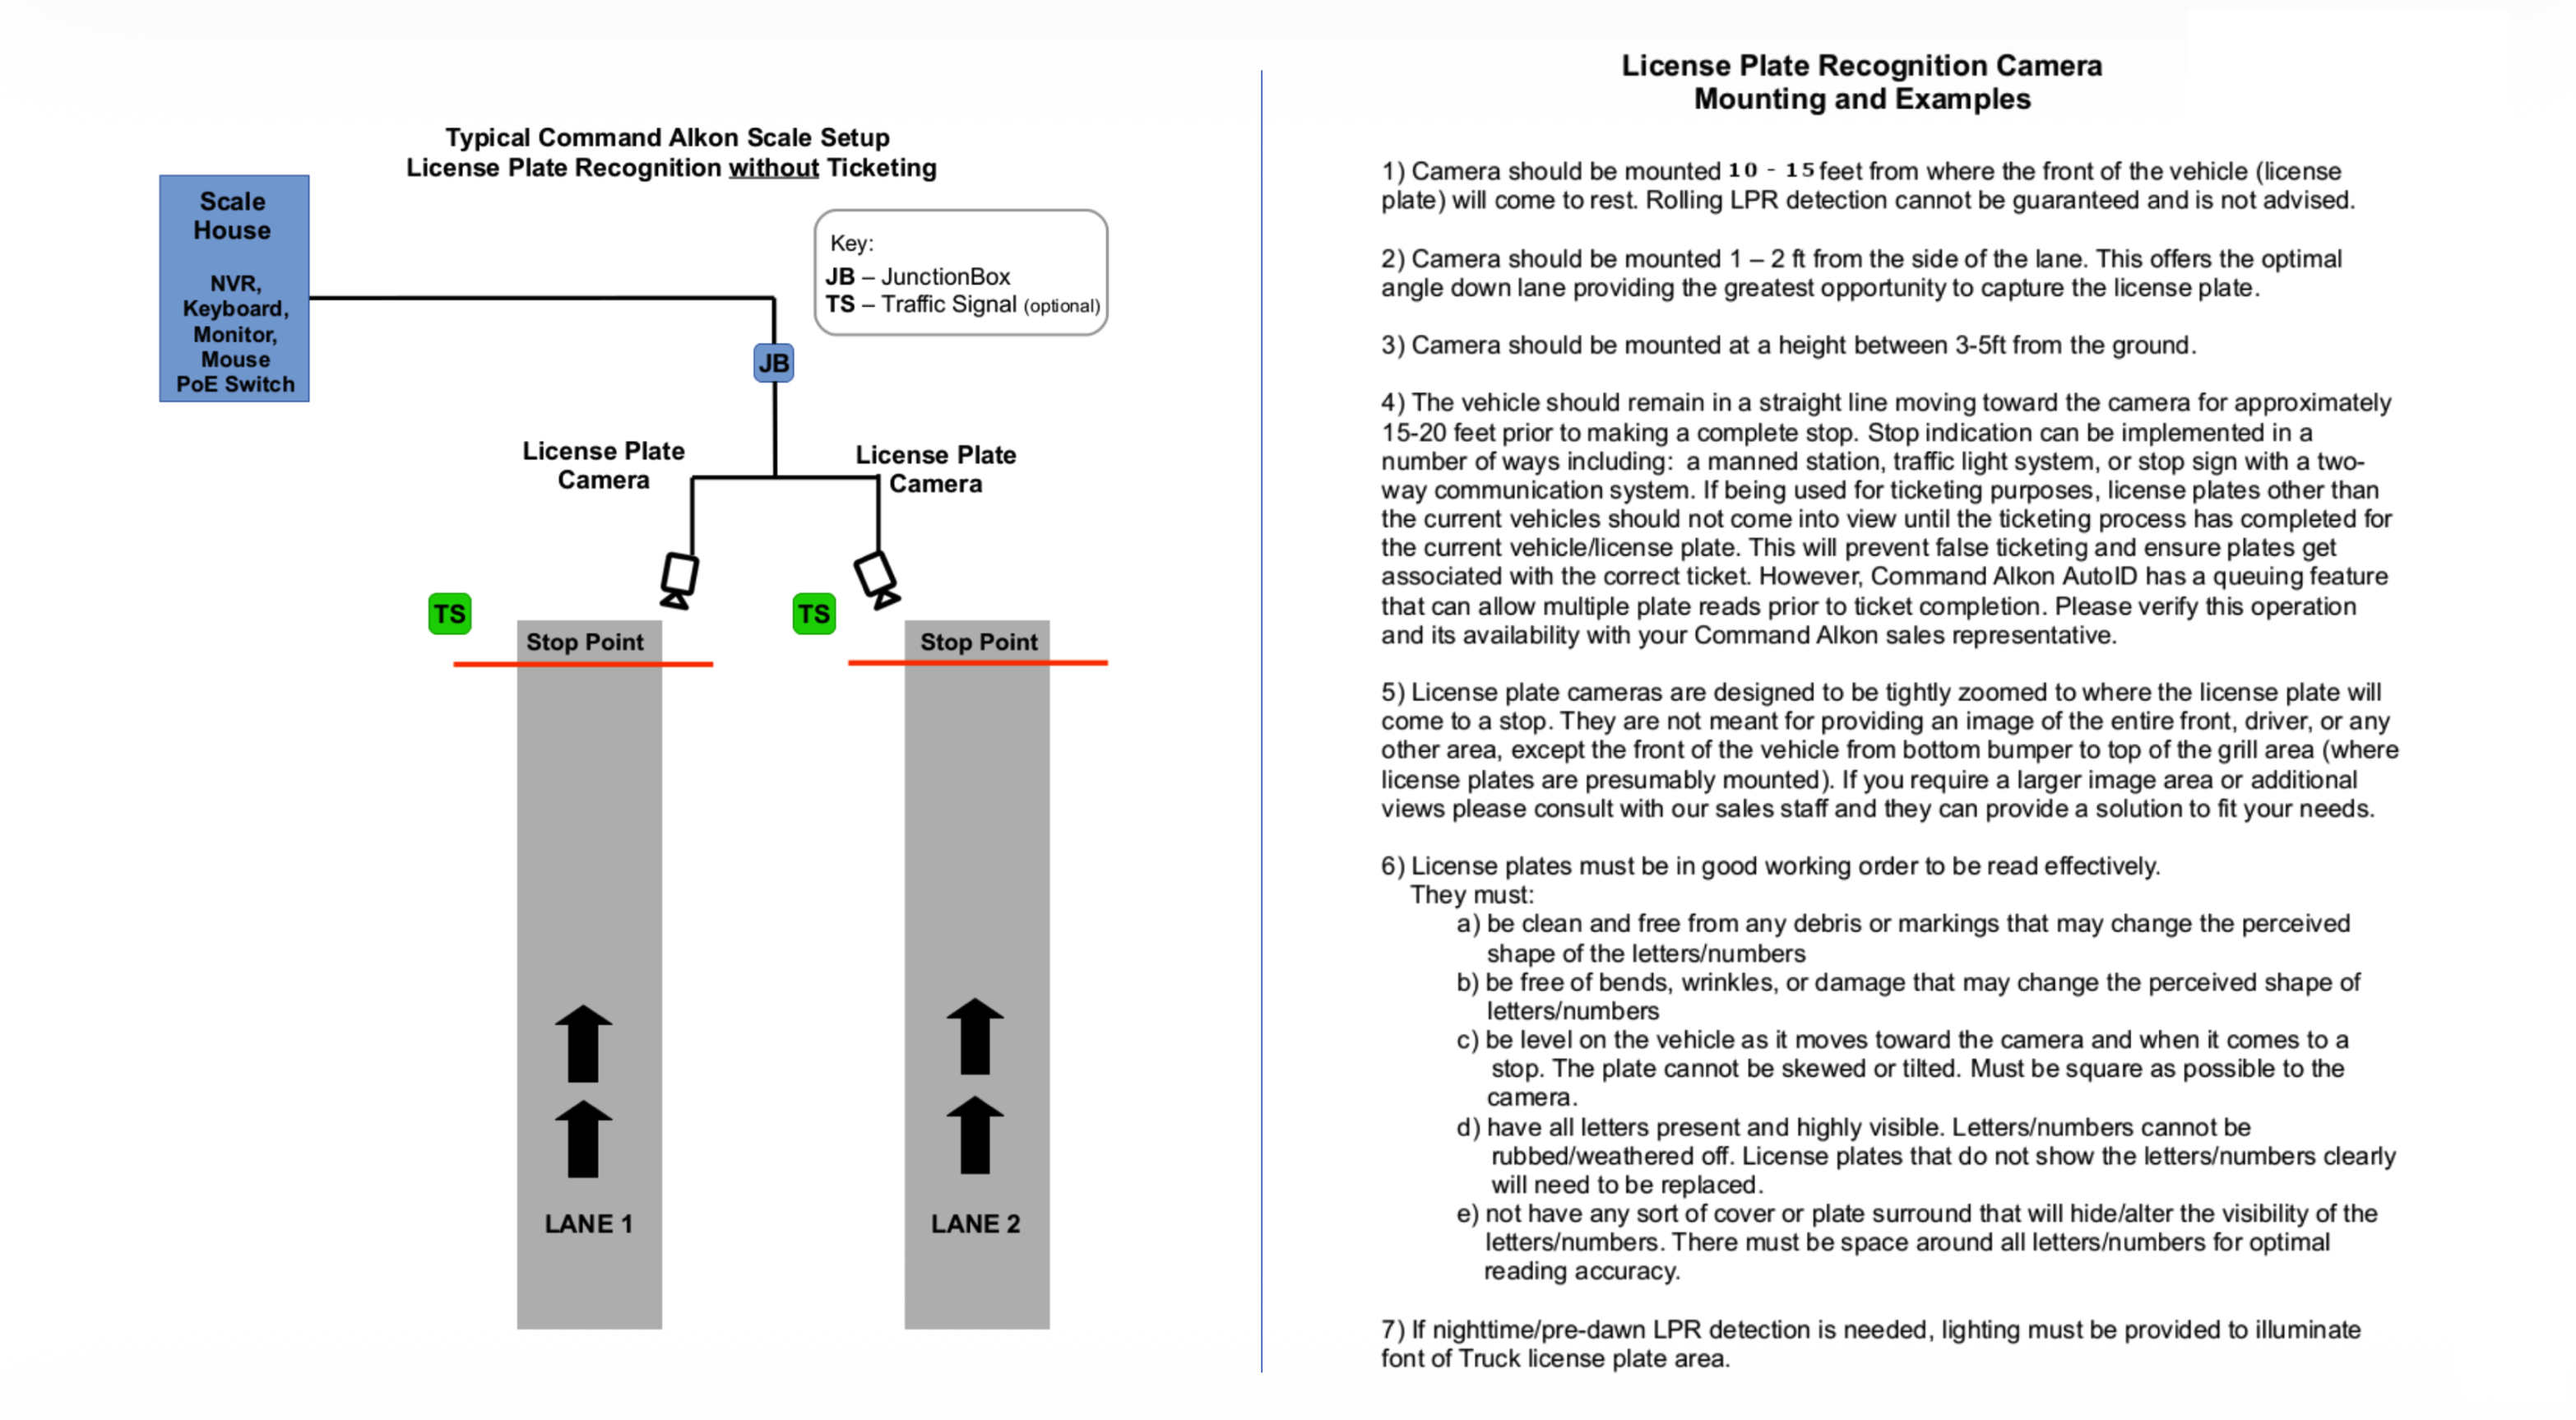
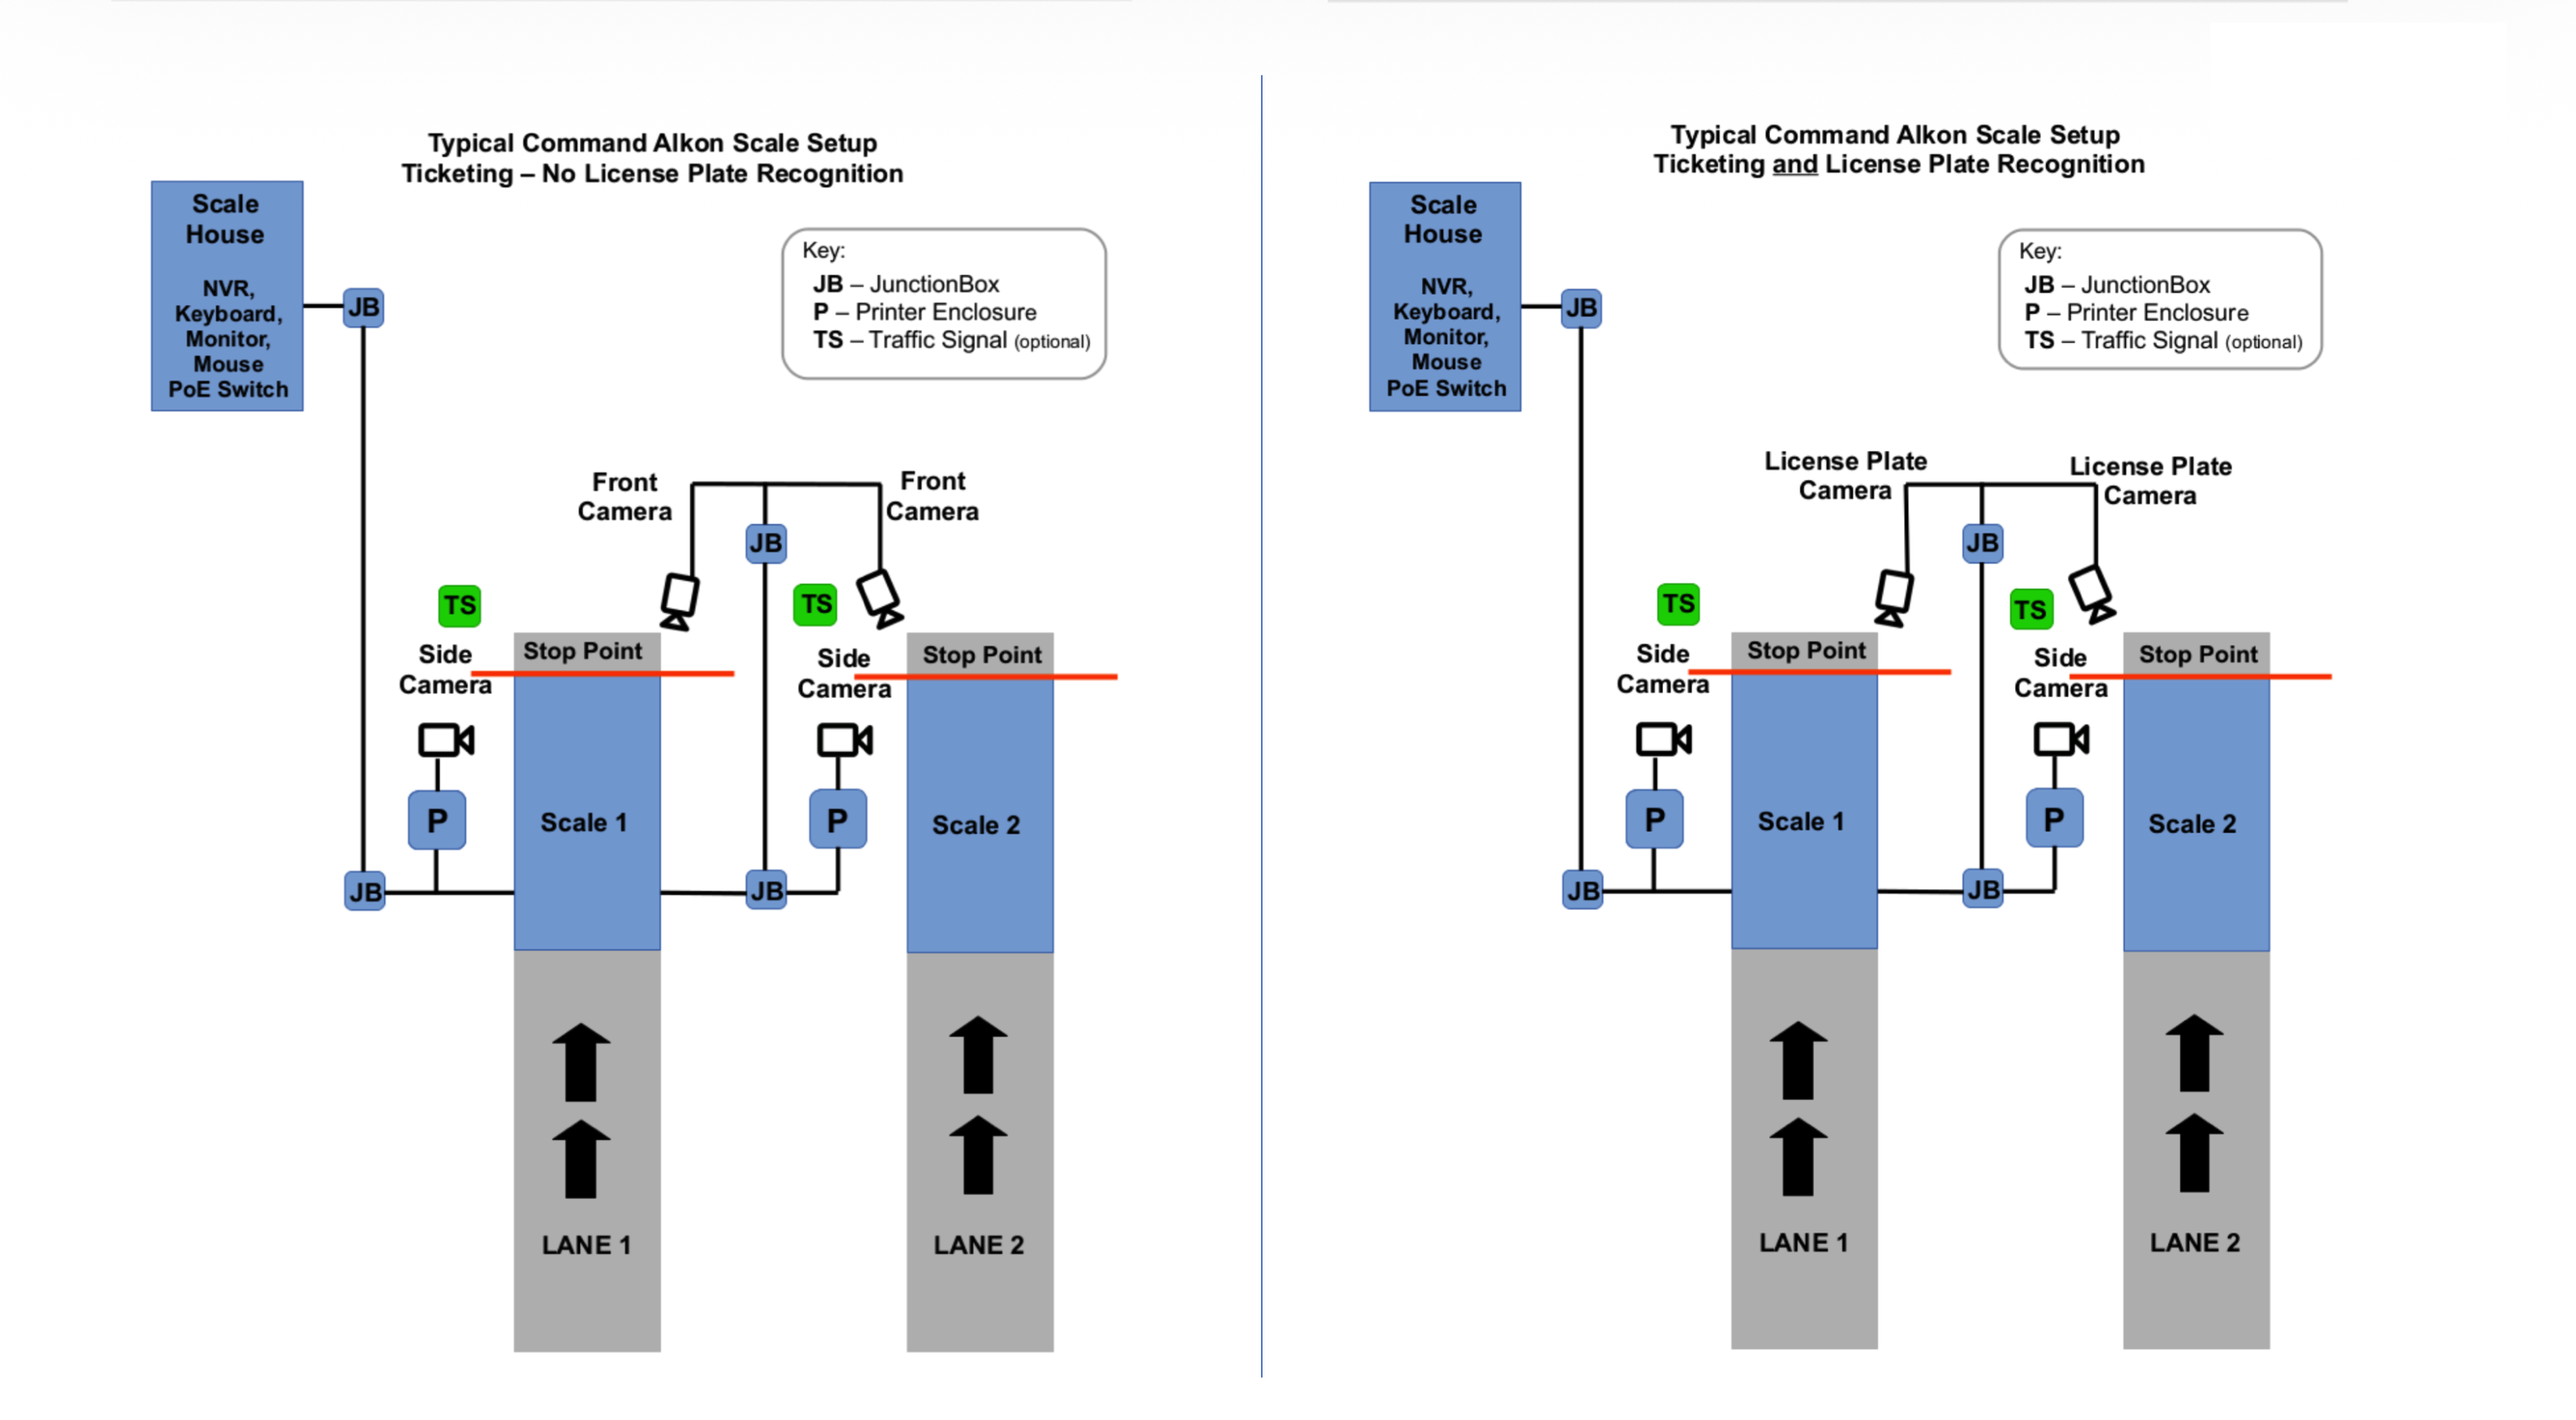
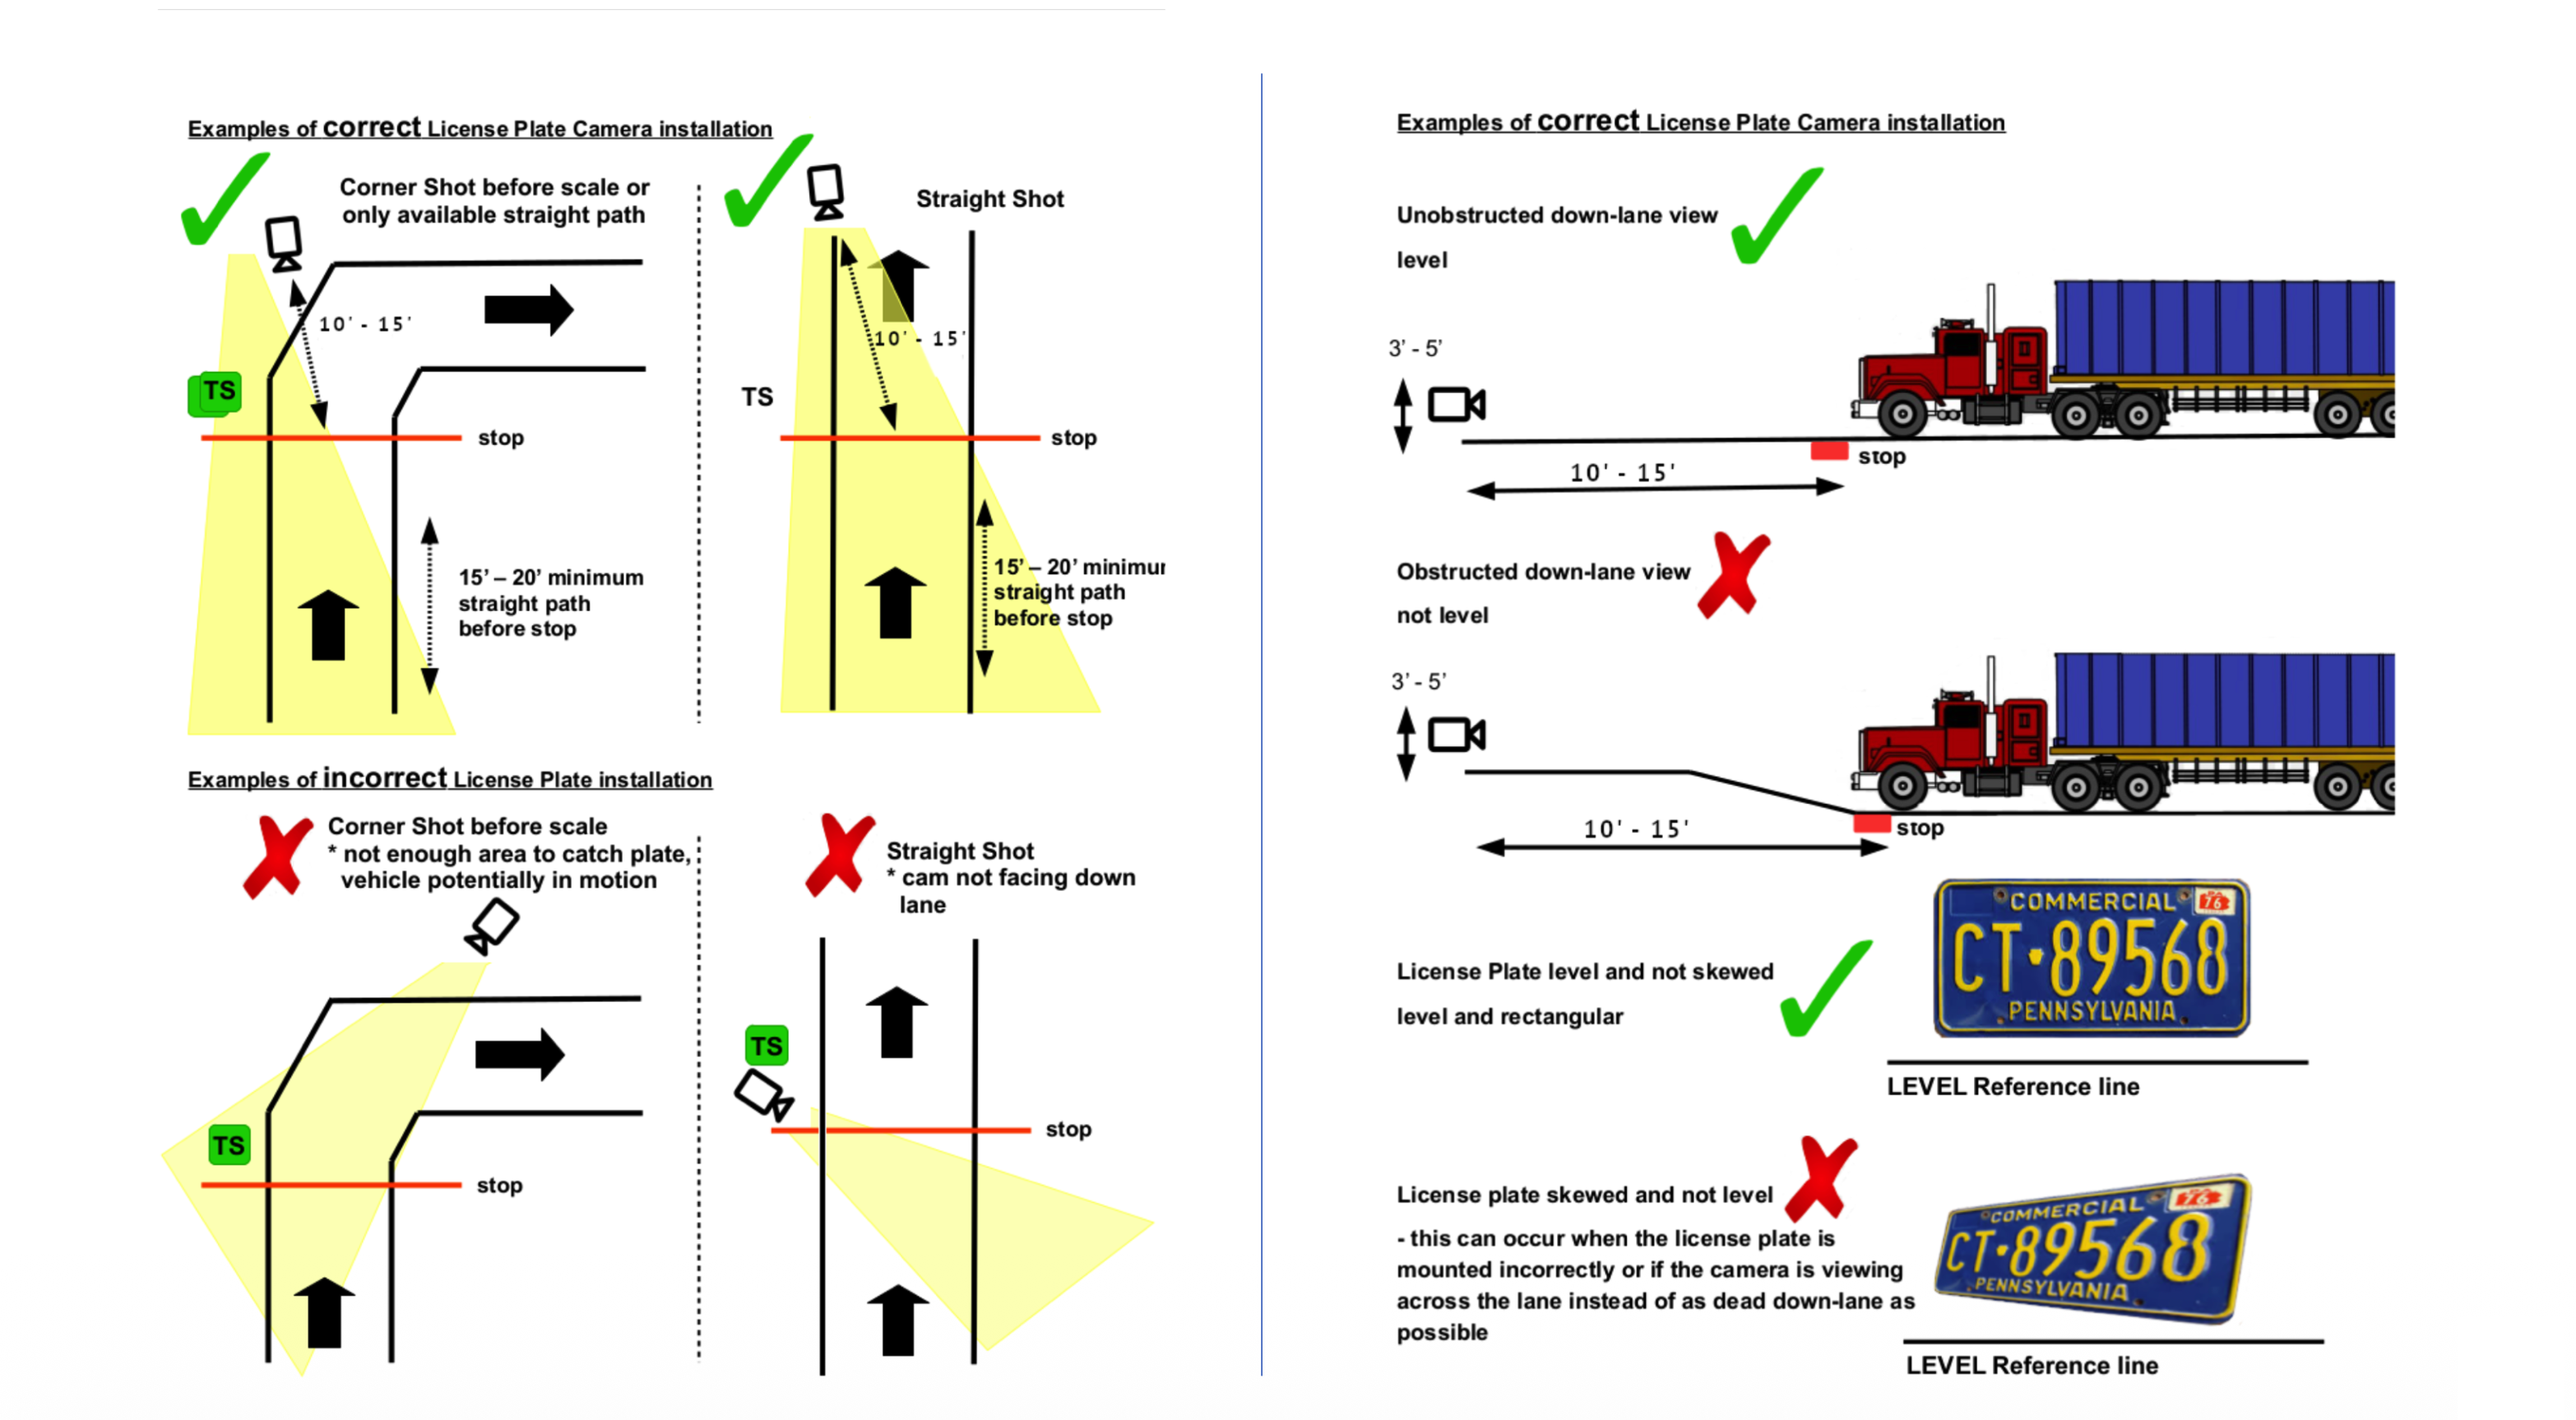
Appendix E: LPR Integration Guidelines
Mounting Example 1Mounting Example 2Mounting Example 3